Technical analysis is a popular approach used by traders to forecast future price movements based on historical data. It involves studying price charts, patterns, and indicators to make informed trading decisions.
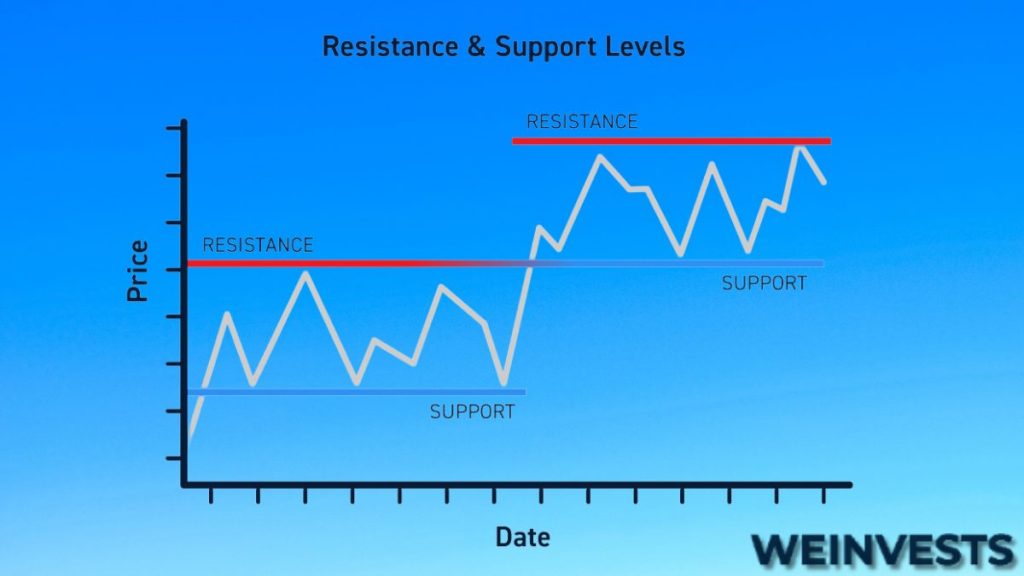
Support and resistance levels are price levels where buying or selling pressure is expected to be strong, causing prices to bounce back or reverse. They play a crucial role in identifying potential entry and exit points for trades.
Understanding Support Levels
Support levels are a crucial concept in technical analysis that help traders identify price levels at which an asset tends to find buying interest and prevents further decline. These levels act as a floor, supporting the price and potentially causing a rebound.
Key characteristics of support levels include a concentration of buying pressure, where demand exceeds supply. Traders observe support levels to anticipate potential reversals or areas to initiate buy positions.
There are different types of support levels in technical analysis:
- Historical support levels are price levels that have previously acted as strong support;
- Psychological support levels, such as round numbers or significant price levels, often attract buying interest due to investor psychology;
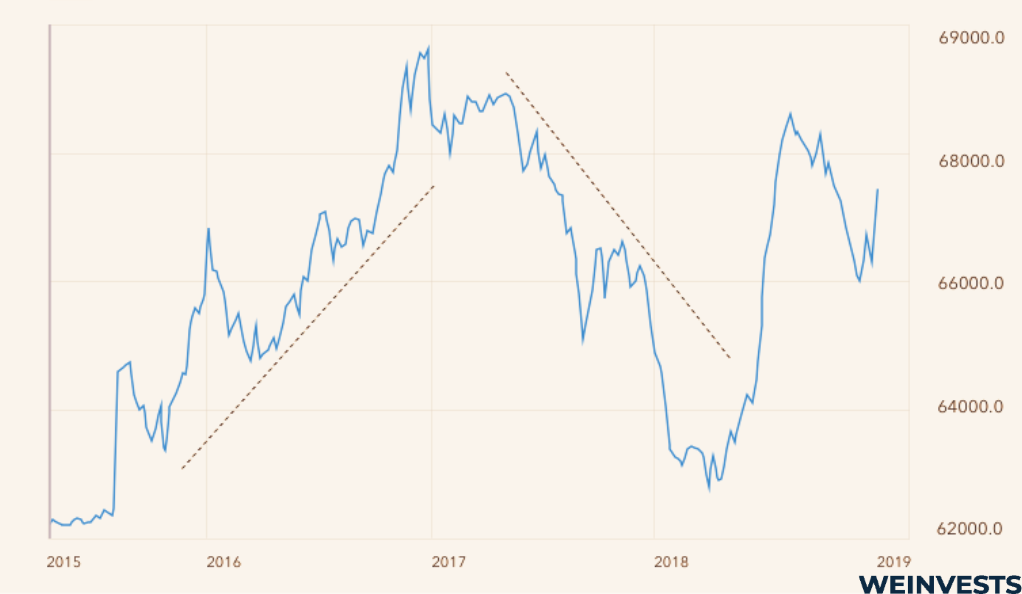
- Trendline support levels are formed by drawing a line connecting higher swing lows, indicating the upward trend’s support;
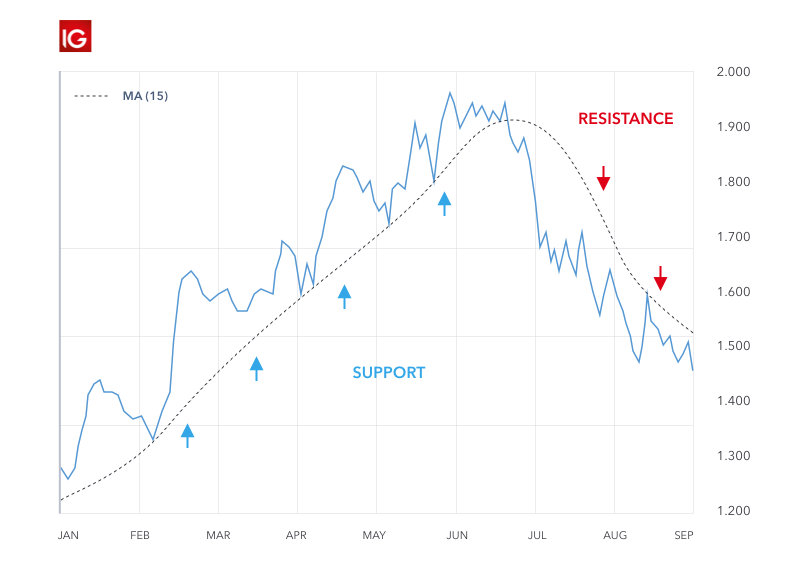
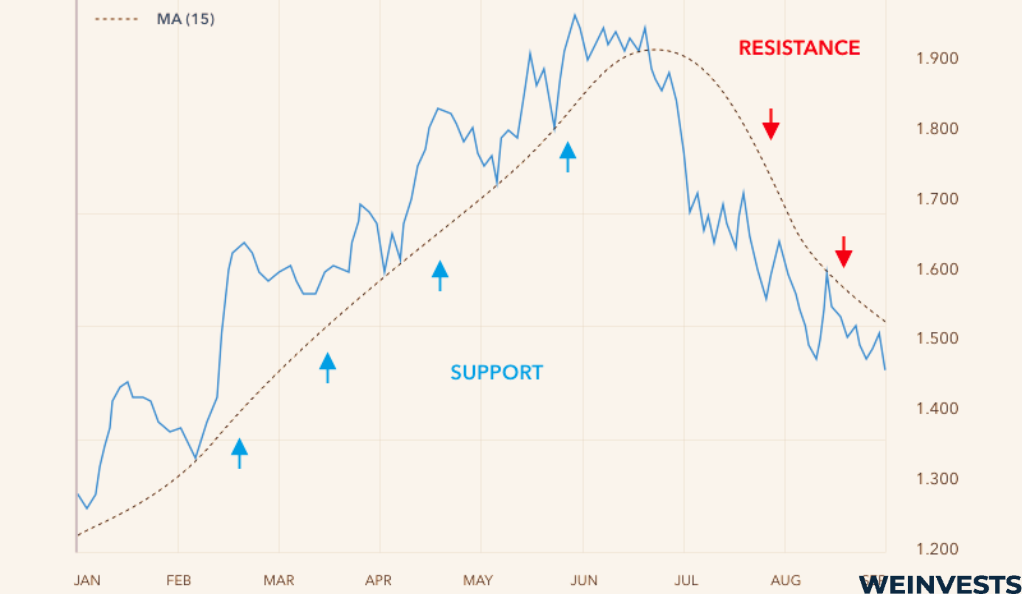
- Moving averages, especially widely followed ones like the 50-day or 200-day moving averages, can also act as dynamic support levels.
Real-life examples demonstrate the significance of support levels. For instance, during a stock’s uptrend, a pullback to a previously established support level may attract buying interest from traders expecting a price bounce. In cryptocurrencies, psychological support levels, such as a round price level like $10,000, often generate buying demand as traders perceive it as an attractive entry point. Additionally, trendline support levels can be observed in forex pairs, where a rising trendline acts as a support level for potential reversals.
Recognizing Resistance Levels
Resistance levels play a significant role in technical analysis as they represent price levels at which an asset tends to face selling pressure. Understanding resistance levels helps traders identify potential areas of price rejection or profit-taking.
Key characteristics of resistance levels include a concentration of selling pressure, where supply exceeds demand. Traders monitor resistance levels to anticipate potential reversals or areas to initiate sell positions.
There are different types of resistance levels in technical analysis:
1 . Historical resistance levels are price levels that have previously acted as strong resistance;
2 . Psychological resistance levels, such as round numbers or significant price levels, often attract selling interest due to investor psychology;
3 . Trendline resistance levels are formed by drawing a line connecting lower swing highs, indicating the downward trend’s resistance;
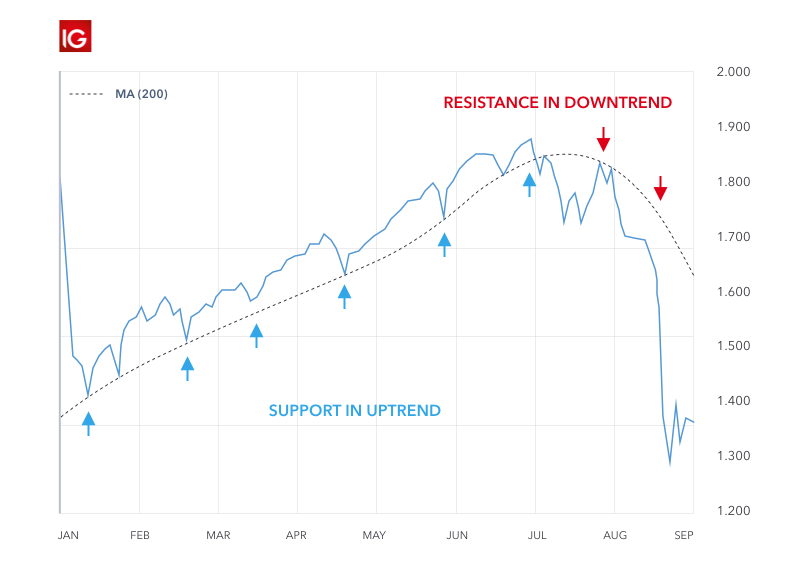
4 . Moving averages, particularly widely followed ones like the 50-day or 200-day moving averages, can also act as dynamic resistance levels.
Real-life examples demonstrate the significance of resistance levels. For instance, in stock markets, a stock’s rally may encounter selling pressure near a historical resistance level, potentially leading to a price pullback.
Importance of Support and Resistance
Support and resistance levels play a crucial role in technical analysis as they provide valuable insights into market trends, aid in risk management, and influence decision-making for trade entry and exit points.
Support and resistance levels help predict market trends by identifying areas where buying or selling pressure is concentrated. When prices approach a support level, it suggests a potential bounce or reversal, indicating a possible uptrend. Conversely, when prices approach a resistance level, it signals a potential price rejection or reversal, indicating a possible downtrend. By recognizing these levels, traders can anticipate market direction and adjust their trading strategies accordingly.
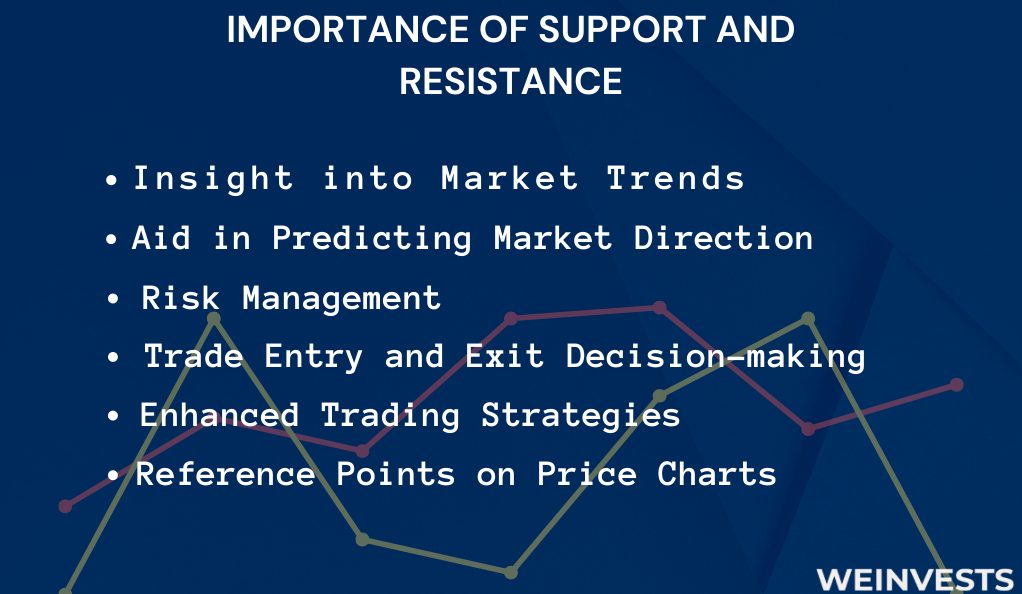
Support and resistance also contribute to risk management. By placing stop-loss orders near support or resistance levels, traders can minimize potential losses if prices break through these levels.
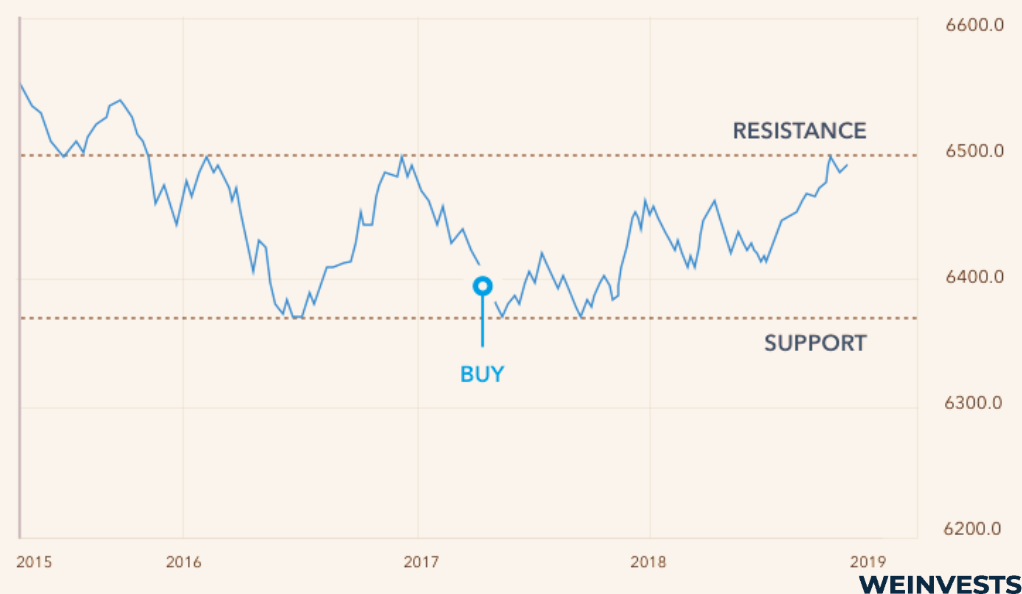
Furthermore, support and resistance levels have implications for decision-making regarding trade entry and exit points. Traders often look for opportunities to enter trades near support levels, as buying interest is expected to increase, providing potential profit opportunities.
By incorporating support and resistance analysis into their trading strategies, traders gain a better understanding of market dynamics, improve risk management practices, and enhance their decision-making process. These levels serve as important markers on price charts, providing valuable reference points for assessing market trends, setting profit targets, and managing risk.
Analyzing Support and Resistance Breakouts
Support and resistance breakouts occur when prices move beyond established support or resistance levels, indicating a potential shift in market sentiment and the potential for a new trend to emerge. Analyzing these breakouts can provide valuable trading opportunities.
Techniques for identifying breakouts involve closely monitoring price action and volume. Traders look for strong, decisive moves above resistance levels or below support levels, accompanied by increased trading volume. These indications suggest that market participants are actively pushing prices beyond these key levels, confirming the breakout.
Strategies for trading breakouts include the use of stop orders to enter trades once a breakout happens. Traders may enter long positions above resistance levels or short positions below support levels, aiming to capture the momentum of the new trend. Additionally, traders often use technical indicators, such as moving averages or momentum oscillators, to validate breakouts and fine-tune their entry and exit points.
False breakouts can occur, where prices briefly move beyond a support or resistance level but fail to sustain the breakout. Traders should exercise caution, use appropriate risk management techniques, and wait for confirmation before committing to trades based on breakouts.
Analyzing support and resistance breakouts allows traders to capitalize on potential trend reversals or the continuation of existing trends. By employing suitable breakout trading strategies and confirming them with other technical indicators, traders can enhance their chances of successful trades while managing risk effectively.
Drawing Support and Resistance Levels
Drawing accurate support and resistance levels is a fundamental skill in technical analysis. These levels help identify key price zones where buying and selling pressures converge. Here are some guidelines for drawing them effectively:
Identify significant price turning points: Look for areas where the price has reversed direction multiple times. These points serve as potential support or resistance levels.
Connect swing highs and lows: Draw trendlines connecting successive higher swing lows for support and lower swing highs for resistance. These trendlines provide dynamic levels that can guide decision-making.
Consider candlestick patterns. Look for areas where candlestick patterns, such as dojis or pin bars, have formed near certain price levels. These patterns can indicate the strength of support or resistance.
Use moving averages: Moving averages can act as dynamic support or resistance levels. Pay attention to when prices interact with key moving averages, as they can offer support or resistance.
Tools and indicators that can aid in drawing support and resistance levels include:
- Horizontal lines. Use the drawing tools on charting platforms to draw horizontal lines across significant price levels. These lines provide clear visual reference points.
- Fibonacci retracements. Apply Fibonacci retracement levels to identify potential support or resistance areas based on retracement percentages derived from key price swings.
- Pivot points automatically calculated by charting software, providing additional reference points for analysis.
Practical examples of drawing support and resistance levels include marking price levels where a stock consistently bounces off a certain level before continuing its upward movement (support), or where a cryptocurrency encounters selling pressure and struggles to break through a specific price (resistance).
Common Mistakes in Support and Resistance Analysis
Identifying accurate support and resistance levels is crucial in technical analysis. However, certain common mistakes can hinder the effectiveness of this analysis. Here are some pitfalls to avoid:
- Mistakes to avoid when identifying support and resistance levels: One common mistake is failing to consider multiple price touches. For example, a single touch may not be sufficient to establish a strong support or resistance level. Additionally, drawing arbitrary lines without proper validation or ignoring historical support and resistance levels can lead to inaccurate analysis.
- Misinterpreting false support signals: False breakouts can occur when prices briefly penetrate support levels but don’t sustain the move. Traders must exercise caution and wait for confirmation before assuming a genuine breakout or breakdown.
- Overlooking dynamic support levels: Traders sometimes focus solely on horizontal support levels while overlooking the significance of dynamic levels. Moving averages, trendlines, and other dynamic indicators can act as strong support or resistance levels, guiding price movements.
To enhance support and resistance analysis, traders should utilize multiple data points, consider historical price behavior, and validate levels with indicators and chart patterns. By avoiding these common mistakes, traders can improve the accuracy of their support and resistance analysis.
Advanced Concepts in Support and Resistance
Incorporating advanced concepts and tools enhances support and resistance analysis. Here are some key elements to consider:
- Pivot points and their significance in support and resistance analysis: Pivot points derive from the previous day’s high, low, and close prices. They provide additional levels of support and resistance for intraday trading. Pivot points act as reference points for determining potential price reversals or breakouts, offering valuable insights into market sentiment and intraday price dynamics.
- Fibonacci retracement levels as support and resistance: Fibonacci retracement levels are based on the Fibonacci sequence, a mathematical sequence where each number is the sum of the two preceding numbers. Traders use these levels to identify potential support and resistance areas based on percentage retracements of a prior price move. The most commonly used Fibonacci levels include 38.2%, 50%, and 61.8%. These levels can help identify key areas where prices are likely to experience support or encounter resistance.
- Volume profile and its relationship with support and resistance: Volume profile analysis involves studying the volume traded at different price levels. It provides insights into areas of strong support or resistance based on significant trading activity. High-volume nodes often act as price magnets, attracting future price action. Traders can use volume profile to identify price levels where institutional traders or significant market participants are active, thus enhancing the reliability of support and resistance analysis.
By incorporating these advanced concepts into support and resistance analysis, traders gain a more comprehensive understanding of market dynamics. Pivot points offer intraday reference levels, Fibonacci retracements provide additional price zones of interest, and volume profile sheds light on areas with strong market participation. Together, these advanced tools complement traditional support and resistance analysis, assisting traders in making informed trading decisions.
The Role of Support and Resistance in Different Markets
Support and resistance analysis is a versatile tool used in various financial markets. Here’s a breakdown of its role in different markets:
- Understanding how support and resistance work in stock markets: In the stock market, support and resistance levels are influenced by factors such as company fundamentals, investor sentiment, and market trends. Support levels represent areas where buying pressure is expected to emerge, preventing prices from declining further. Resistance levels, on the other hand, denote zones where selling pressure is likely to increase, limiting further upside potential. Traders and investors in stocks use support and resistance analysis to identify potential entry and exit points and make informed trading decisions.
- Support and resistance analysis in the forex market: economic data, central bank policies, geopolitical events, and market sentiment influence the forex market. Support and resistance levels in forex trading are crucial in identifying potential price reversals, breakouts, or breakdowns. These levels help traders anticipate market turning points and manage risk effectively. Currency pairs often exhibit strong support and resistance levels based on historical price patterns and significant market interest.
- Applying support and resistance principles in cryptocurrency trading: Cryptocurrencies have unique characteristics that can affect support and resistance levels. Factors such as trading volumes, market sentiment, regulatory developments, and technical factors play a role in determining support and resistance levels. Traders in the cryptocurrency market use support and resistance analysis to identify key levels where prices may encounter obstacles or show significant buying or selling interest.
Support and Resistance Indicators and Tools
You can optimize support and resistance analysis by utilizing various indicators and tools specifically designed for this purpose. Here are some popular ones:
- Moving averages: Moving averages are widely used to identify dynamic support and resistance levels. For example, price bounces off moving averages can indicate areas of support or resistance, helping traders make informed trading decisions.
- Bollinger Bands: Bollinger Bands consist of a moving average and two standard deviation bands. They dynamically adjust to market volatility and are useful to identify support and resistance levels. When prices penetrate the upper band, it suggests potential resistance, while breaches of the lower band indicate potential support.
- Online tools and software: Various online tools and software are available to assist with support and resistance analysis. These tools often provide features such as automatic identification of key levels, customizable settings, and the ability to plot support and resistance lines on charts. They can save time and help traders accurately identify and track support and resistance levels.
When using support and resistance indicators and tools, it’s important to understand their limitations and consider them in conjunction with other technical analysis techniques. No single indicator or tool is foolproof, and traders should validate their findings through multiple sources of analysis.
Support and Resistance in Combination with Other Technical Analysis Tools
Support and resistance levels can be further reinforced and validated by combining them with other technical analysis tools. Here are two key ways support and resistance interact with other tools:
- Trendlines and chart patterns: Support and resistance levels often align with trendlines and chart patterns, creating confluence and strengthening their significance. Trendlines can be drawn to connect higher swing lows in an uptrend or lower swing highs in a downtrend, providing additional confirmation of support or resistance levels. Chart patterns like triangles, head and shoulders, or double tops/bottoms often have support and resistance elements that coincide with the pattern’s structure. Combining support and resistance analysis with trendlines and chart patterns helps traders identify high-probability trade setups and potential trend reversals.
- Oscillators and momentum indicators: Oscillators and momentum indicators, such as the Relative Strength Index (RSI) or Stochastic Oscillator, can be used in conjunction with support and resistance levels. These indicators help assess the strength or weakness of price movements and can generate overbought or oversold signals. When these indicators align with support or resistance levels, it strengthens the validity of potential price reversals. For example, if the price approaches a strong resistance level while the RSI indicates overbought conditions, it suggests a higher probability of a downward reversal.
By combining support and resistance analysis with trendlines, chart patterns, and oscillators, traders can enhance their understanding of potential market reversals, breakouts, or continuations. These combinations provide a more comprehensive view of the market, increasing the accuracy of trading decisions. However, it’s essential to use a balanced approach and consider the overall market context to avoid relying solely on one indicator or tool.
Impact of News and Events on Support and Resistance Levels
Economic news releases, corporate announcements, geopolitical events, and other major market-moving factors can significantly influence support and resistance levels. Understanding how news and events impact these levels is crucial for successful trading. Here’s a more detailed exploration:
- Influence of economic news and events on support and resistance: Economic indicators, such as GDP reports, interest rate decisions, employment data, inflation figures, or consumer sentiment surveys, can have a profound impact on support and resistance levels. Positive or negative news can cause prices to break through existing levels or reinforce them as traders react to new information. For instance, strong economic data may lead to a breakout above a resistance level, while disappointing news can trigger a breakdown below a support level.
- Strategies for incorporating news analysis into support and resistance: Traders can incorporate news analysis into their support and resistance analysis by monitoring upcoming economic releases, central bank announcements, earnings reports, or major geopolitical events. By aligning their support and resistance levels with key news events, traders can anticipate potential market reactions and adjust their trading strategies accordingly. They can also use news-based breakouts or breakdowns as confirmation for support and resistance levels.
Moreover, traders should consider the impact of news on market sentiment and investor psychology. Positive news can fuel optimism and drive prices higher, potentially leading to a breach of resistance levels. Conversely, negative news can spark pessimism and lead to support levels being tested or broken.
It is important to stay updated with news calendars, follow reliable news sources, and remain flexible in response to unexpected events that can impact support and resistance levels. Integrating news analysis with support and resistance analysis can provide traders with a comprehensive understanding of market dynamics and enhance their trading decisions.
Case Studies: Support and Resistance in Historical Market Movements
Examining notable historical market movements can provide valuable insights into the significance of support and resistance levels. Here are some case studies that highlight the importance of support and resistance:
- Case study: S&P 500 Index – The S&P 500, a widely followed stock market index, experienced a significant downtrend during the global financial crisis of 2008. As the index declined, it encountered a strong support level near the 1,250 level, which had previously acted as resistance. This support level held multiple times, indicating its significance. Traders who recognized this level could have anticipated potential reversals or bounce-backs, managing their risk and capitalizing on trading opportunities.
- Case study: Bitcoin – Bitcoin, the popular cryptocurrency, exhibited notable support and resistance levels during its price surge in late 2017. After reaching an all-time high near $20,000, Bitcoin experienced a substantial correction. The $6,000 level, which had previously acted as resistance, became a critical support level, holding multiple times. Traders who identified this level could have used it as a reference for potential buying opportunities or as a level for setting stop-loss orders.
It’s important to note that support and resistance levels are not perfect and market conditions can change. Traders should use additional analysis and risk management techniques in conjunction with support and resistance before trading.
Summary: The Power of Support and Resistance in Technical Analysis
Support and resistance are foundational concepts in technical analysis that play a crucial role in successful trading.
Throughout this article, we explored their significance in various markets and their interaction with other analysis tools. Support and resistance levels aid traders in identifying entry/exit points, managing risk, and making informed decision. Accurate identification deepens understanding of market dynamics, enhancing trading strategies and performance. Incorporating support and resistance analysis into your technical analysis toolkit can significantly enhance your trading skills and improve your overall trading performance.
Frequently Asked Questions (FAQs)
What are the main differences between support and resistance?
Support is a price level at which buying pressure is expected to outweigh selling pressure, causing prices to potentially reverse or bounce back. Resistance, on the other hand, is a price level where selling pressure is expected to exceed buying pressure, potentially leading to price reversals or pullbacks.
Can support levels become resistance levels, and vice versa?
Yes, support levels can turn into resistance levels and vice versa. A broken support level often becomes a resistance level as traders who bought at that price now tend to sell. Similarly, when a resistance level is breached, it can act as a support level as buyers enter the market at that level.
How can I determine the strength of a support or resistance level?
The strength of a support or resistance level can be evaluated based on the number of times it has been tested and held, the volume traded at that level, and the duration of time it has been in play. The more times a level has been respected and the higher the trading volume associated with it, the stronger the support or resistance level is considered.
Are support and resistance levels universal across different timeframes?
Support and resistance levels are not universal across different timeframes. Shorter timeframes may have more localized support and resistance levels, while longer timeframes tend to have more significant and influential levels.
What happens when support or resistance levels break?
When a support level breaks, it typically signals a potential downtrend or a move to lower levels. Conversely, when a resistance level is breached, it can indicate the possibility of an uptrend or a move to higher levels. These breaks can lead to increased volatility and potentially trigger further price movements.
How do I effectively use support and resistance levels in my trading strategy?
They can help identify potential entry and exit points, set stop-loss orders, validate chart patterns, and determine profit targets. Traders often look for price reactions at these levels, such as bounces, breakouts, or reversals, to make trading decisions.
WeInvests is a financial portal-based research agency. We do our utmost best to offer reliable and unbiased information about crypto, finance, trading and stocks. However, we do not offer financial advice and users should always carry out their own research.
Read More