This content represents the writer’s opinions and research and is not intended to be taken as financial advice. The information presented is general in nature and may not meet the specific needs of any individual or entity. It is not intended to be relied upon as a professional or financial decision-making tool.

Are you looking for a simple trading strategy that works 52% of the time? Technical indicators can be a powerful tool in giving you the edge you need when trading in the stock markets. In this blog post, we’ll look at what technical indicators are, and how you can use stochastic, RSI, and MACD trading strategies to make informed trading decisions. In this article, we will discuss what a Stochastic + RSI + MACD trading strategy is and its benefits.
Table of Contents
- What is a Stochastic Oscillator?
- What is MACD?
- What is RSI?
- How To Trade The Stochastic, RSI and MACD Strategy?
- How To Use Stochastic, RSI, and MACD?
- Stochastic + RSI + MACD Strategy With eToro
- Stochastic + RSI + MACD Strategy into TradingView
- Integrate the Stochastic + RSI + MACD strategy into MetaTrader 4 (MT4)
- The Trick To Using RSI In Your Trading
- How To Use This Strategy For Day Trading?
- Conclusion
What is a Stochastic Oscillator?
The Stochastic Oscillator is a momentum indicator that can be used to determine whether a stock is overbought or oversold. It also acts as a good divergence indicator, which means it will show when the price of a security has diverged from its momentum.
The basic concept behind this strategy is that you’re buying around the key support levels of the Stochastic Oscillator and selling around resistance levels.
Here’s how it works: You’ll want to find a stock that has good momentum but is in a temporary lull. If you look at the Stochastic Oscillator, it will show you where this lull is. For example, if the price of the security has been going up steadily but suddenly drops below 20, then this could be an indicator that there’s some selling pressure building up, and it’s time to take advantage of this information by placing your trade accordingly. The same goes for when you see the price break through key resistance levels on its way down; these can be used as support levels for your trades moving forward.
What is MACD?
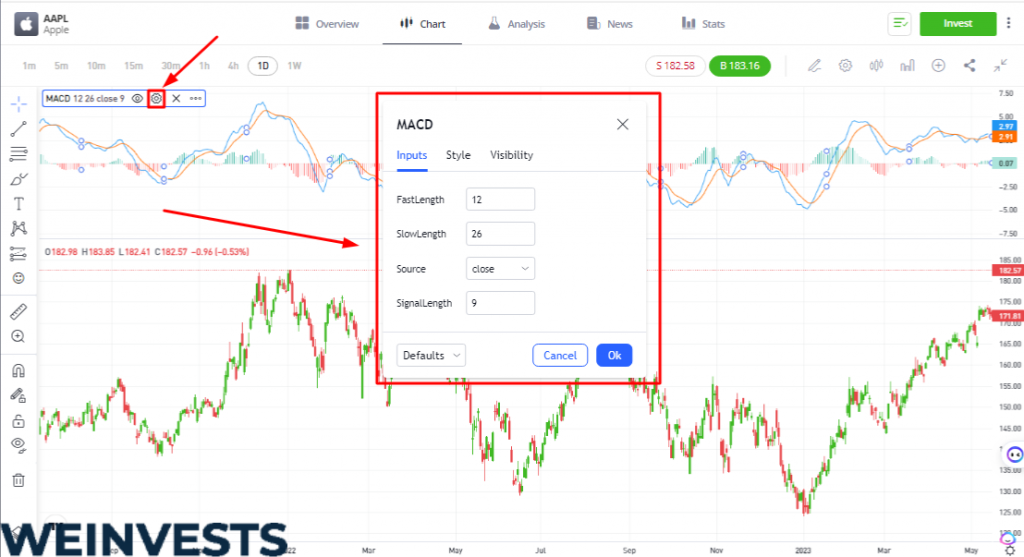
The MACD is a popular technical indicator that helps investors analyze the momentum of a security. It’s a trend-following momentum indicator that shows the relationship between two moving averages of prices. The MACD has four lines: the MACD line, a signal line, a zero line, and a histogram.
MACD is calculated by subtracting the 26-period Exponential Moving Average (EMA) from the 12-period EMA. The resulting MACD line is then plotted along with a signal line, which is a 9-period EMA of the MACD line. The MACD line is used to identify entry and exit points for trades. When the MACD line crosses above the signal line, it indicates that the price trend is gaining momentum and traders can enter a buy position. Conversely, when the MACD line crosses below the signal line, it indicates that the price trend is losing momentum, and traders can enter a sell position.
The MACD can also be used to identify overbought and oversold conditions in the markets. When the MACD line is above zero, it indicates that the price is above its long-term moving average and is in an overbought condition. When the MACD line is below zero, it indicates that the price is below its long-term moving average and is in an oversold condition.
What is RSI?
RSI, or Relative Strength Index, is a widely used technical indicator for traders and investors. It is used to measure the speed and change of price movements, and to identify overbought and oversold conditions. RSI is a momentum oscillator, meaning it measures the magnitude of recent price changes to evaluate overbought or oversold conditions in the price of a stock. The RSI is calculated using a simple mathematical formula that compares the magnitude of a stock’s recent gains to the magnitude of its recent losses over a specified time period. The resulting RSI value is then plotted on a scale of 0 to 100, with 0 representing the most oversold and 100 representing the most overbought.
The RSI is typically used as an overbought/oversold indicator, which means that traders use it to identify when a stock is overbought or oversold. If a stock’s RSI is above 70, it is considered overbought, and if it is below 30, it is considered oversold. Traders use the RSI to identify potential buying and selling opportunities. They may buy when the RSI is below 30, or sell when the RSI is above 70.
Here’s an example of RSI indicator on a stock chart.
Traders can also use the RSI to identify divergences, which can be used to spot potential reversals in the price of a stock. A bullish divergence occurs when the price of a stock is making lower lows, but the RSI is making higher lows. A bearish divergence occurs when the price of a stock is making higher highs, but the RSI is making lower highs. Traders can use these divergences to spot potential reversals in the price of a stock.
The RSI is an invaluable tool for identifying potential buying and selling opportunities in the stock market. By using the RSI to identify overbought and oversold conditions, as well as potential divergences, traders can be better equipped to make more informed decisions when trading.
How To Trade The Stochastic, RSI and MACD Strategy?
This strategy works on both stocks, crypto and forex. It’s a simple and effective way to trade Stochastic, MACD, and RSI together. But these indicators can also be used alone.
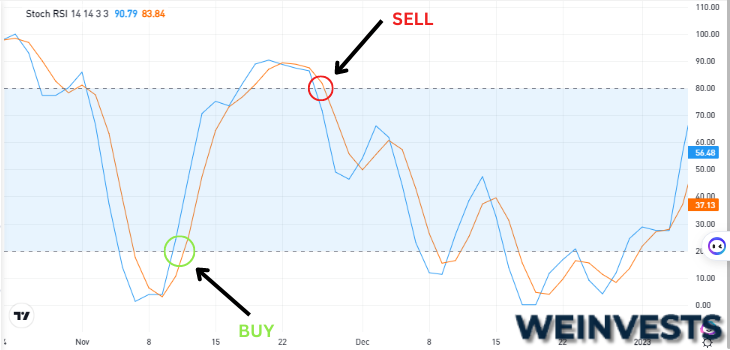
The idea behind this strategy is that if the price of an asset is going up and down quickly, there’s a lot of volatility in the market – and that means riskier trades are more likely to pay off than safe ones. So when you see an oversold reading on your indicator (Stochastic), buy; when you see an overbought reading, sell!
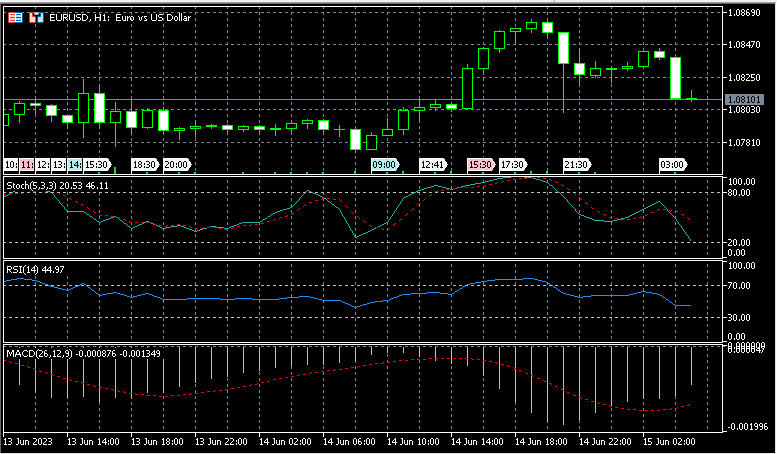
Here’s how it looks in practice:
The Stochastic, RSI and MACD strategy is a trend following strategy. The Stochastic oscillator acts as a signal to enter the trade, while the RSI oscillator and MACD histogram act as confirmation signals.
The strategy works best on 15-minute charts or higher. It’s designed for intraday trading and should be used on high frequency time frames.
The Stochastic, RSI and MACD Strategy:
- Identify trends on the chart using indicators such as moving averages and trend lines.
- Enter trades when stochastic crosses over 80% or crosses under 20%. You can also use other cross thresholds such as 50/70%.
- Confirm your trade by using a different indicator such as RSI or MACD histogram crossing over or under its respective signal line.
Stochastic indicators compare the closing price of a stock over a given period to the range of prices over that period. If you see your stochastic move up and cross above 80%, this indicates that your stock has reached an area where it will likely continue to climb for some time unless something negative happens in the news or with another company’s product release. We call this situation “overbought” because once something becomes overly popular, there may not be enough demand left for people to buy them at higher prices so easily anymore — and sometimes this leads to a selloff!
How To Use Stochastic, RSI, and MACD?
You can use the Stochastic Oscillator to confirm your trade. The RSI will tell you if a stock is overbought or oversold, while the MACD can help identify whether a stock is in an uptrend or downtrend.
When buying a stock, it’s important that both indicators point upward before you enter your order. If they aren’t, then wait until they do before placing your buy order. Conversely, when selling a stock, it’s important that both indicators are pointing downward before you enter your order. If they aren’t, then wait until they do before placing your sell order.
Stochastic + RSI + MACD Strategy With eToro
If you want to apply this strategy in your trading, you need a platform that supports both the stochastic RSI and MACD indicators. One such platform is eToro, which is a popular social trading platform that allows you to trade stocks, forex, cryptocurrencies, and more. Here’s how to set up the stochastic RSI and MACD indicators on eToro:
- Log in to your eToro account: Open your browser and navigate to the eToro website. Enter your username and password to log in to your account.
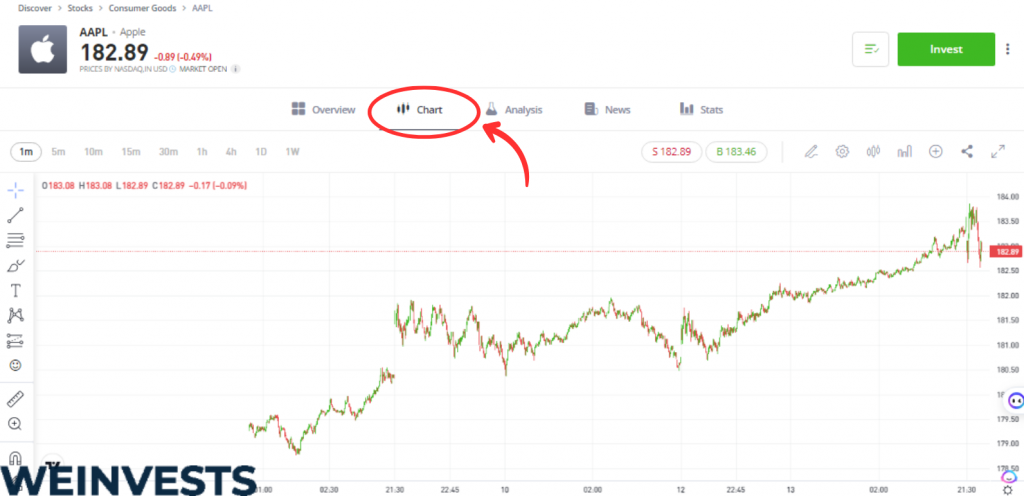
- Select an asset to trade: From your dashboard, choose an asset you are interested in trading. This could be stocks, forex, cryptocurrencies, etc. Click on the chosen asset to open its detailed view.

- Open the chart view: There should be a “Chart” tab or a similar option in the detailed view of the asset. Click on this to open the chart view.
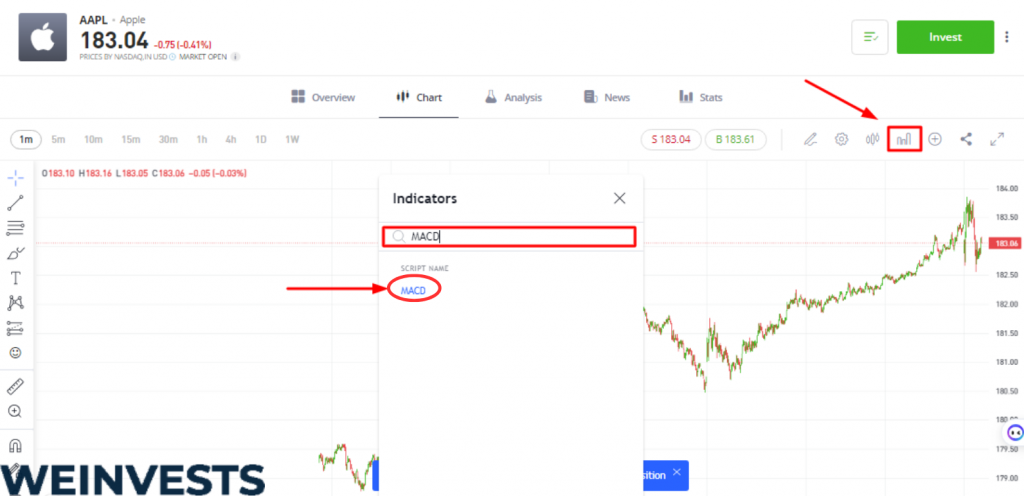
- Add the MACD indicator:
- Look for an “Indicators” button, usually represented with an icon like a wave or a line chart. Click on this button to open a menu with a list of available indicators.
- Scroll through the list or use a search function (if available) to find the MACD indicator. Click on it to add it to your chart.
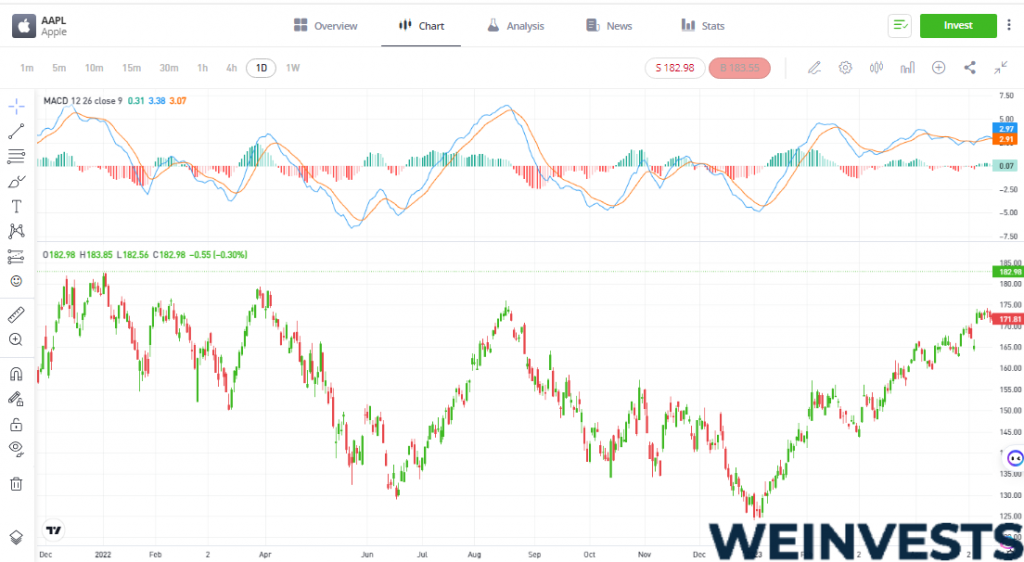
- The MACD indicator should now be visible on your chart. It usually appears as two lines (the MACD line and the signal line) and a histogram.
- Adjust the MACD settings: Some platforms allow you to customize the parameters of your indicators. If this is available and you wish to change the default settings, look for a “Settings” or “Properties” option within the MACD indicator. Here, you can adjust the periods of the moving averages as per your trading strategy.
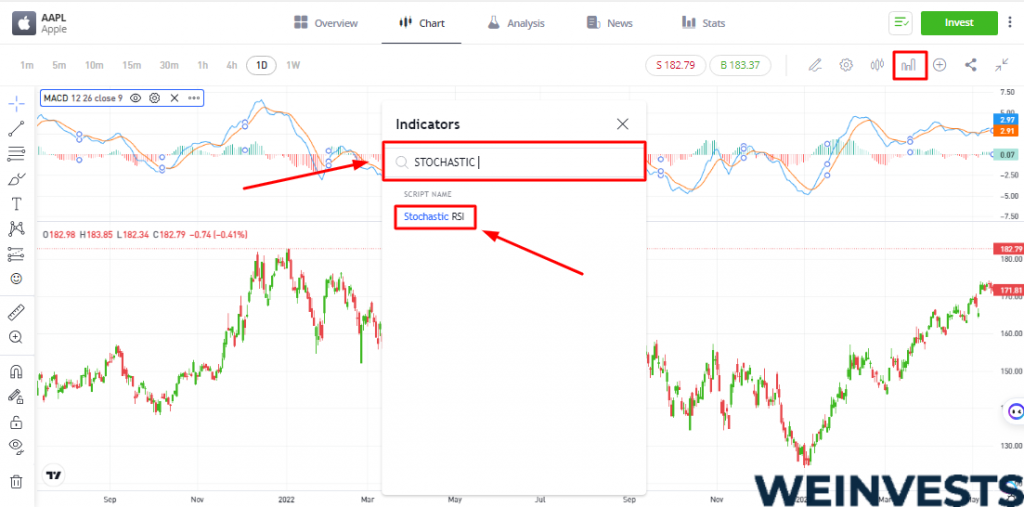
- Add the Stochastic RSI indicator:
- Again, click on the “Indicators” button to open the list of available indicators.
- Find the Stochastic RSI indicator in the list or using the search function and click on it to add it to your chart.
- The Stochastic RSI indicator should now be visible on your chart.
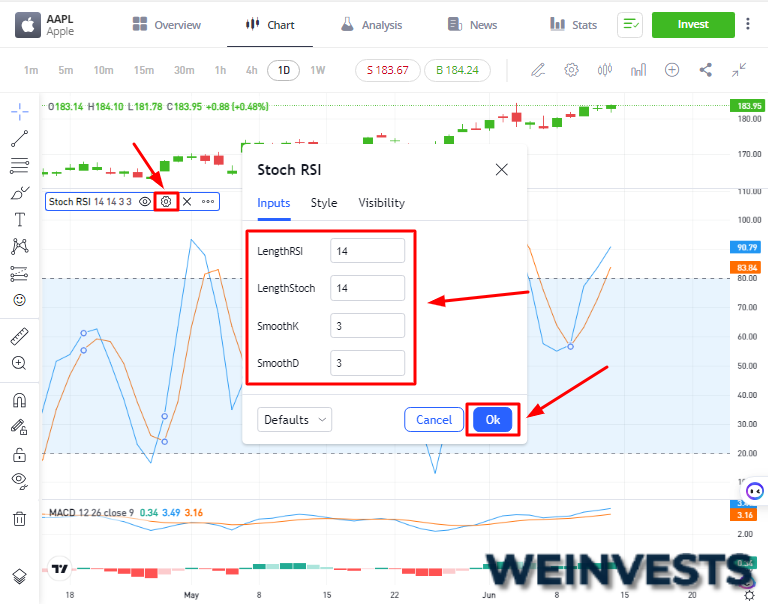
- Adjust the Stochastic RSI settings: Similar to the MACD indicator, if the platform allows, you can adjust the parameters of the Stochastic RSI indicator through a “Settings” or “Properties” option.
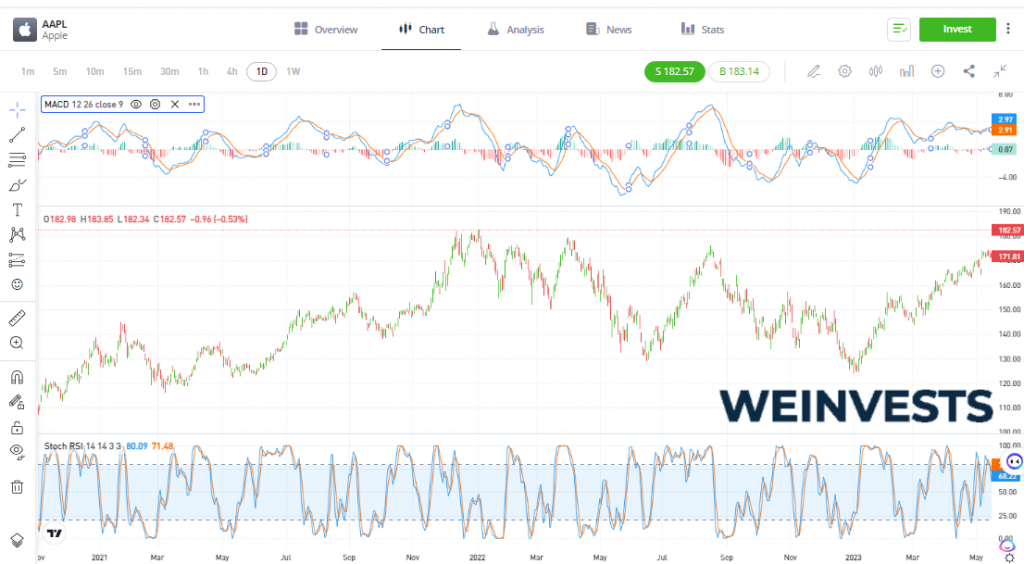
- Analyze the indicators and make your trade: With both indicators now visible on your chart, you can start to analyze their movements to inform your trading decisions. Remember, each indicator provides different kinds of signals that can help you decide when to enter or exit a trade.
Remember to always use these indicators as part of a comprehensive trading strategy and to test any changes you make to indicator settings with a demo account or paper trading before risking real money.
If you’re interested in trying out this strategy on eToro, you can sign up for a free account today and get access to a $100,000 demo account. This will allow you to practice the strategy without risking any real money. You can also switch to a real account anytime and start trading with as little as $200. Click here to join eToro and start trading with the stochastic RSI and MACD strategy.
Stochastic + RSI + MACD Strategy into TradingView
You can easily integrate the Stochastic + RSI + MACD strategy into TradingView, a popular charting platform with built-in technical indicators and the ability to create custom scripts using Pine Script. Here’s how to set it up:
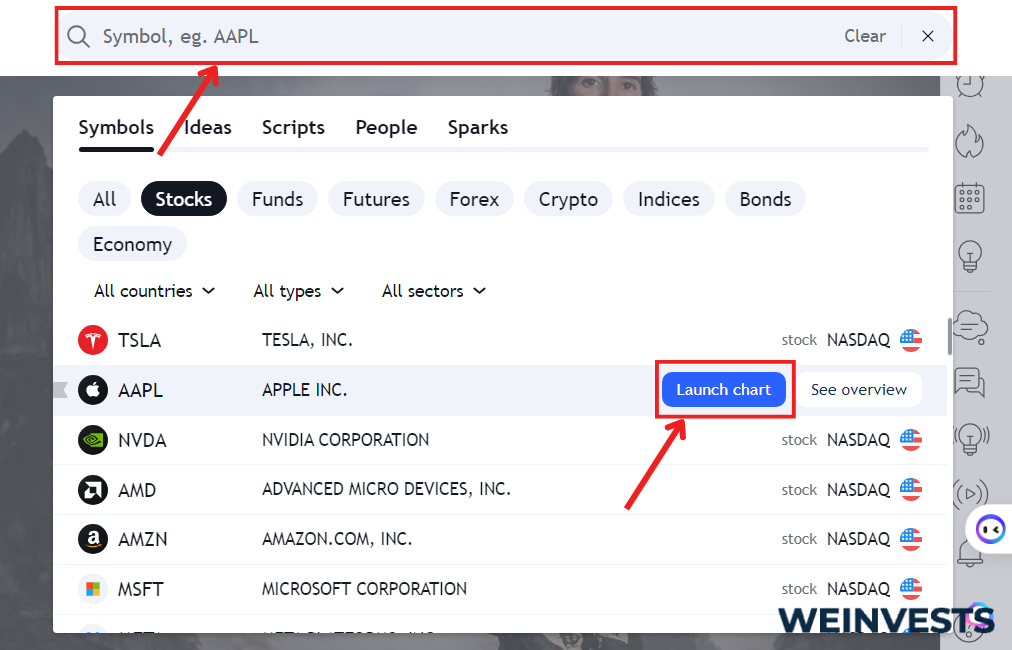
- Open TradingView and navigate to the chart of the asset you’d like to analyze.
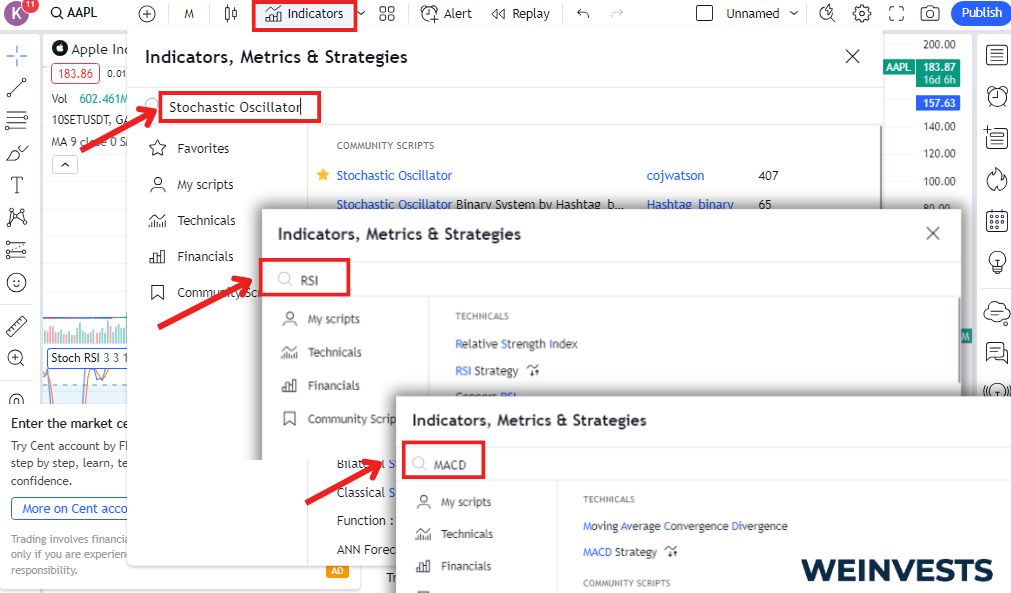
- Add the Stochastic Oscillator, RSI, and MACD indicators to your chart by clicking the “Indicators” icon at the top of the page (it looks like a f(x) symbol). Search for each indicator and click on it to add it to the chart. You can adjust the settings by clicking on the gear icon next to each indicator’s name in the upper-left corner of the chart.
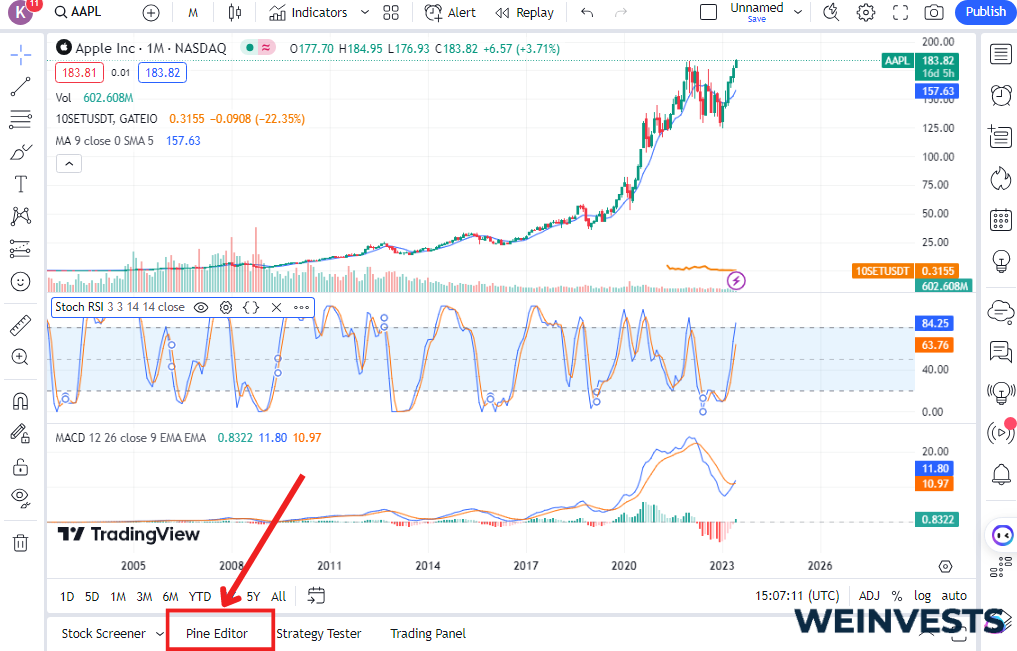
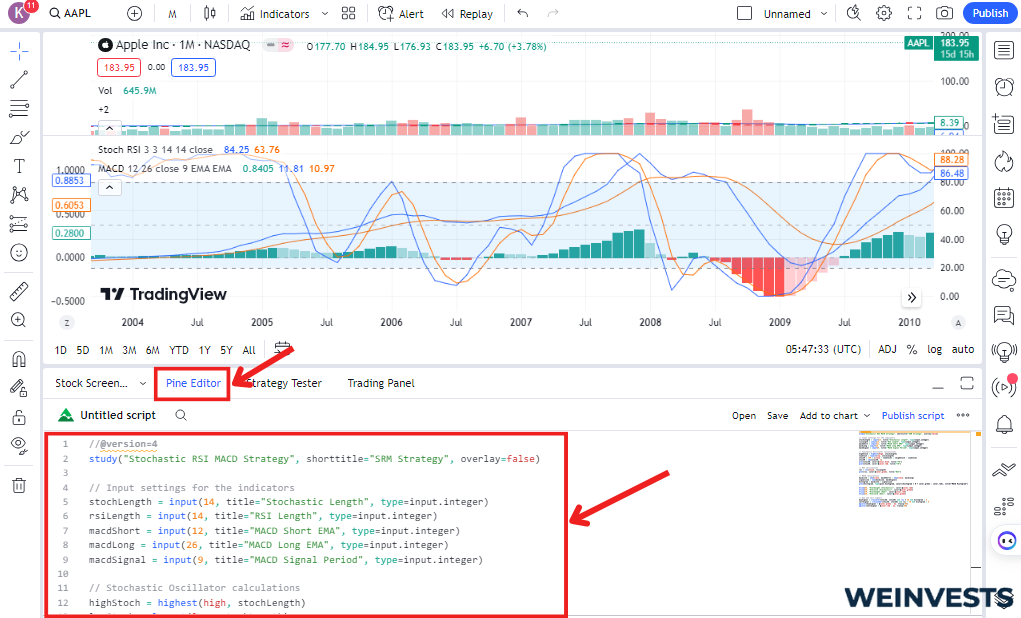
- To create custom alerts or signals based on the strategy, you’ll need to use Pine Script, TradingView’s scripting language. Click on the “Pine Editor” tab at the bottom of the page.
- Paste the following Pine Script code into the Pine Editor:
//@version=4
study("Stochastic RSI MACD Strategy", shorttitle="SRM Strategy", overlay=false)

// Input settings for the indicators
stochLength = input(14, title="Stochastic Length", type=input.integer)
rsiLength = input(14, title="RSI Length", type=input.integer)
macdShort = input(12, title="MACD Short EMA", type=input.integer)
macdLong = input(26, title="MACD Long EMA", type=input.integer)
macdSignal = input(9, title="MACD Signal Period", type=input.integer)

// Stochastic Oscillator calculations
highStoch = highest(high, stochLength)
lowStoch = lowest(low, stochLength)
stochK = 100 * (close - lowStoch) / (highStoch - lowStoch)
stochD = sma(stochK, 3)
plot(stochK, color=color.blue, title="%K")
plot(stochD, color=color.red, title="%D")

// RSI calculations
rsi = rsi(close, rsiLength)
plot(rsi, color=color.green, title="RSI")

// MACD calculations
macdLine = ema(close, macdShort) - ema(close, macdLong)
signalLine = sma(macdLine, macdSignal)
histogram = macdLine - signalLine
plot(histogram, type=plot.histogram, color=(histogram > 0 ? color.green : color.red), title="MACD Histogram")

hline(80, "Overbought (Stochastic)", color=color.red)
hline(20, "Oversold (Stochastic)", color=color.green)
hline(70, "Overbought (RSI)", color=color.red)
hline(30, "Oversold (RSI)", color=color.green)

// Buy and sell signals
buySignal = crossover(stochK, stochD) and rsi < 30 and histogram > 0
sellSignal = crossunder(stochK, stochD) and rsi > 70 and histogram < 0
bgcolor(buySignal ? color.green : na, transp=90)
bgcolor(sellSignal ? color.red : na, transp=90)
- Click the “Add to Chart” button at the bottom of the Pine Editor. This will add the custom script to your chart, displaying the Stochastic Oscillator, RSI, and MACD Histogram along with overbought and oversold levels. The chart’s background color will change to green for buy signals and red for sell signals based on the strategy.
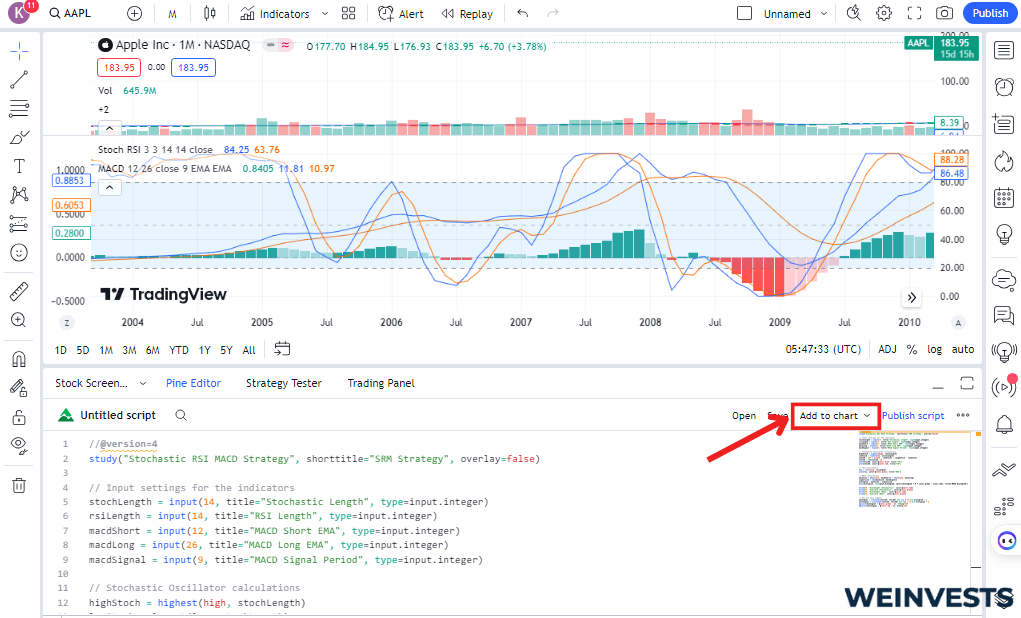
Source: https://www.tradingview.com/
Integrate the Stochastic + RSI + MACD strategy into MetaTrader 4 (MT4)
MetaTrader 4 (MT4), another popular trading platform. While I’m using MT4 as an example, the process will be similar for other platforms.
- Open MetaTrader 4 and navigate to the chart of the asset you’d like to analyze.
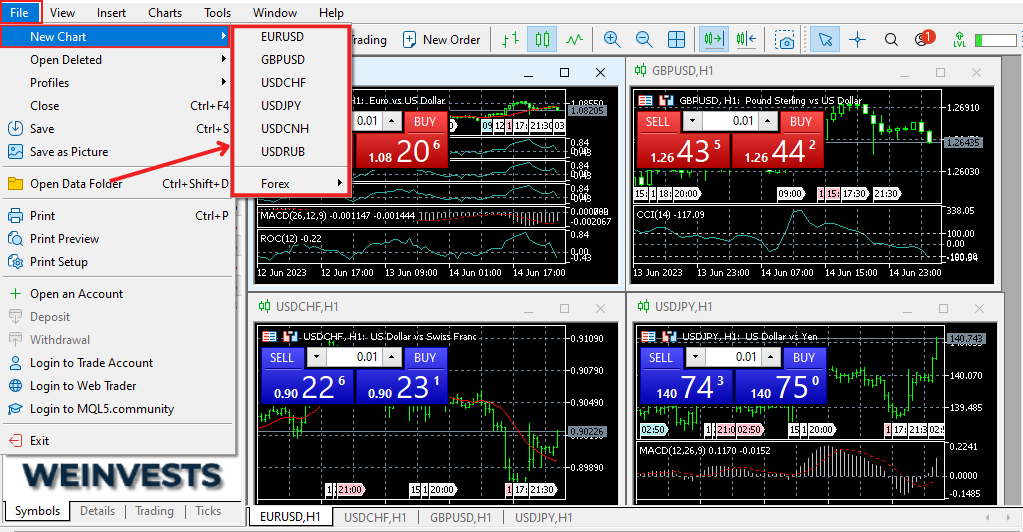
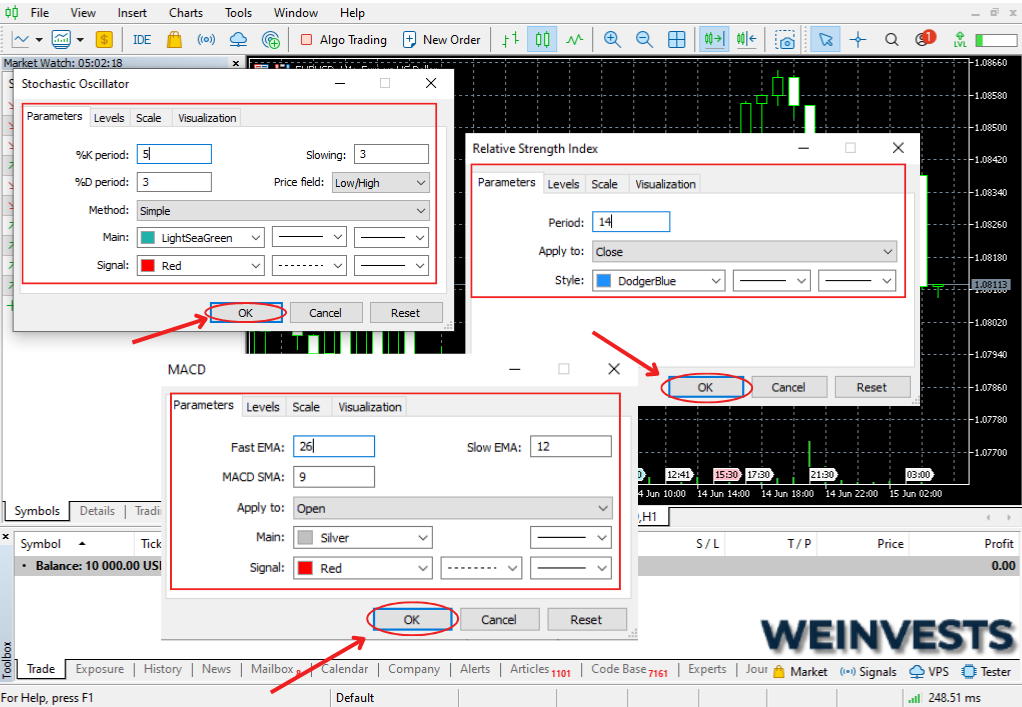
- Add the Stochastic Oscillator, RSI, and MACD indicators to your chart by clicking “Insert” in the menu bar, then selecting “Indicators” and choosing the relevant indicators from the “Oscillators” and “Trend” categories.
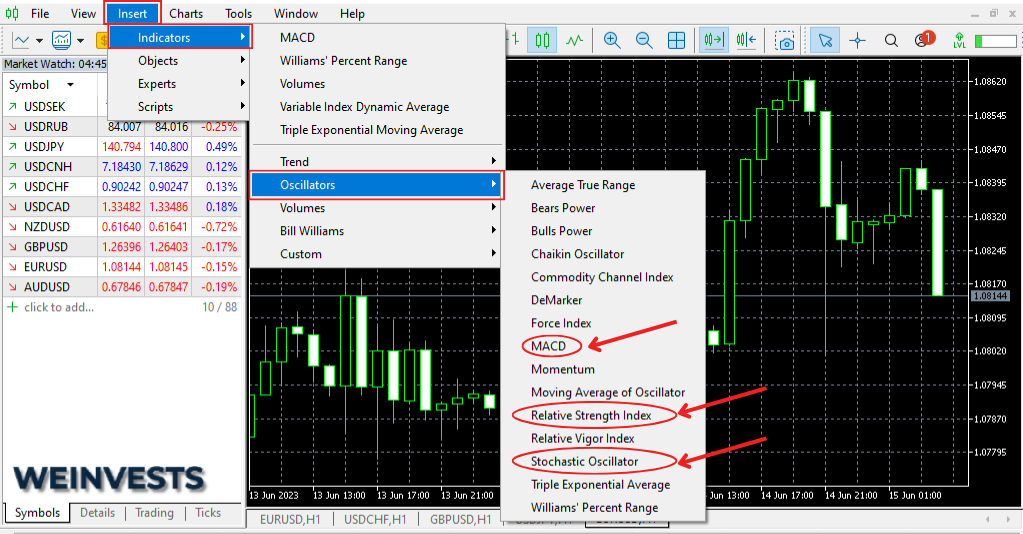
- Adjust the settings for each indicator by right-clicking on the indicator line and selecting “Properties” or “Indicator Properties.” Input the desired settings and click “OK.”
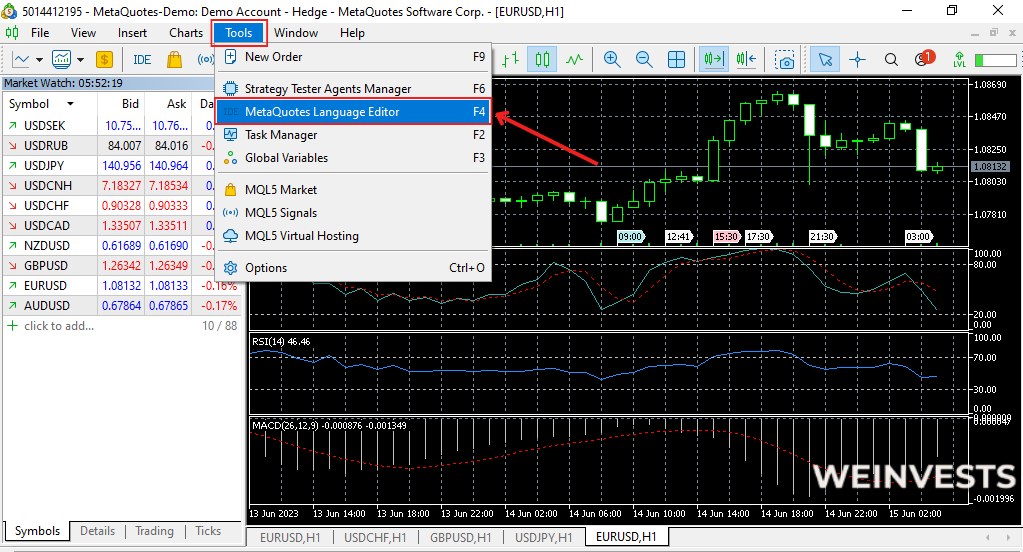
- To create custom alerts or signals based on the strategy, you’ll need to use MQL4 (MetaQuotes Language 4), MetaTrader 4’s scripting language. First, open the MetaEditor by clicking “Tools” in the menu bar and selecting “MetaQuotes Language Editor.”
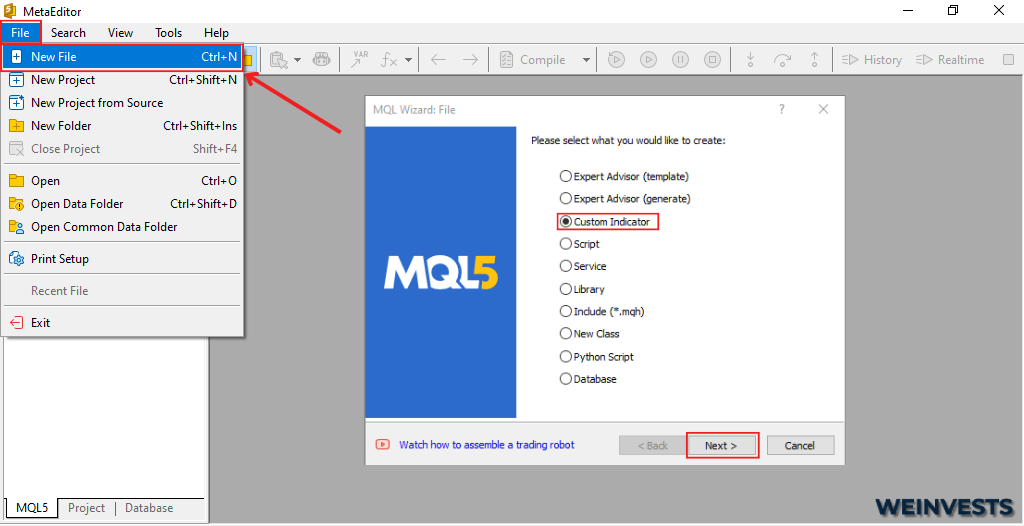
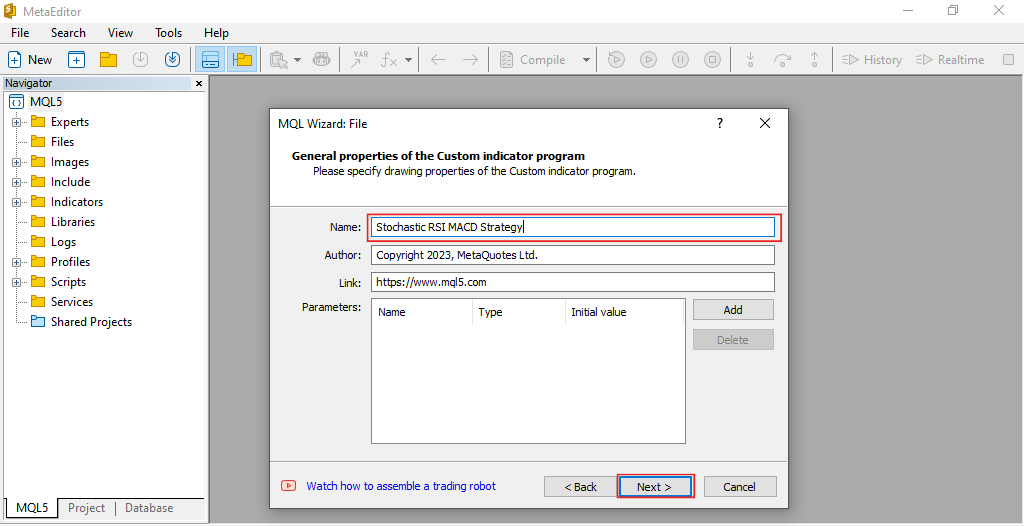
- In the MetaEditor, click “File,” then “New” to create a new Custom Indicator. Choose “Custom Indicator” and click “Next.” Give your indicator a name, such as “Stochastic RSI MACD Strategy,” and click “Finish.”
- Replace the default code in the new indicator file with the appropriate MQL4 code for the Stochastic + RSI + MACD strategy. Please note that converting the Pine Script code I provided earlier to MQL4 is beyond the scope of this response, but there are resources available online to help you with this task, such as MQL4 documentation and forums.
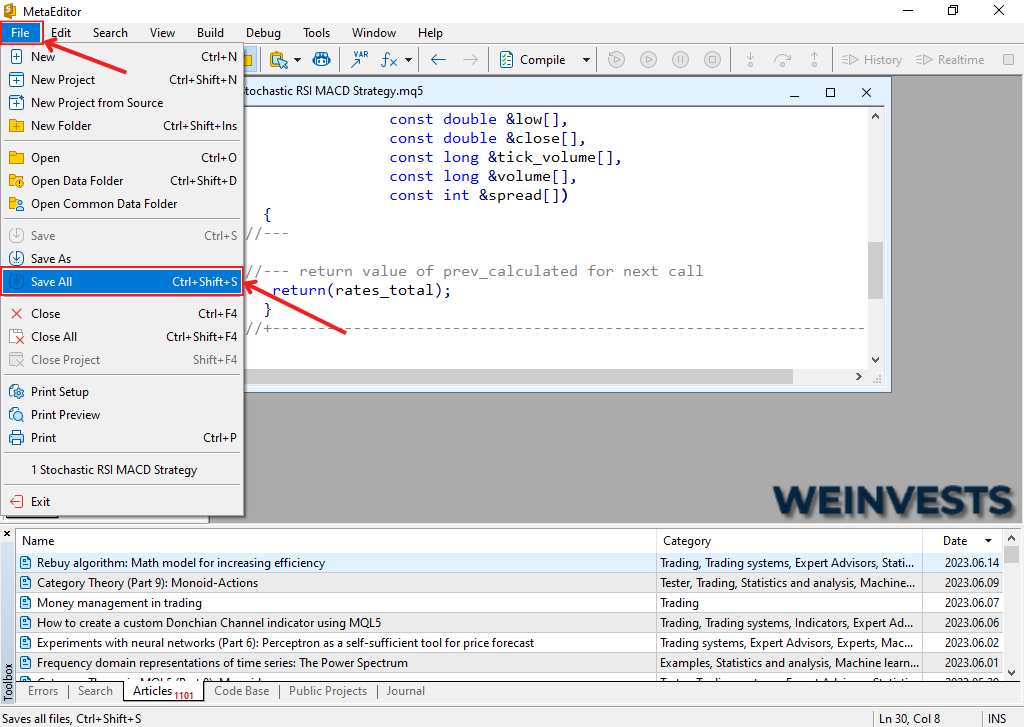
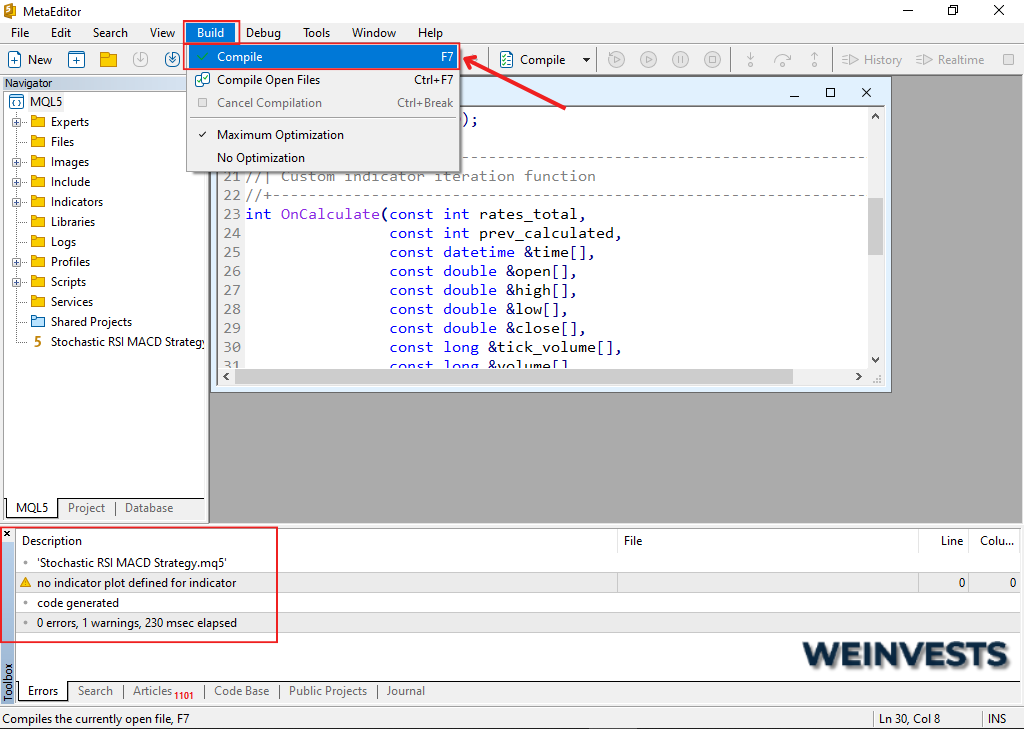
- Once you have the MQL4 code in place, click “File” and then “Save” in the MetaEditor. Next, click “Compile” to compile your custom indicator.
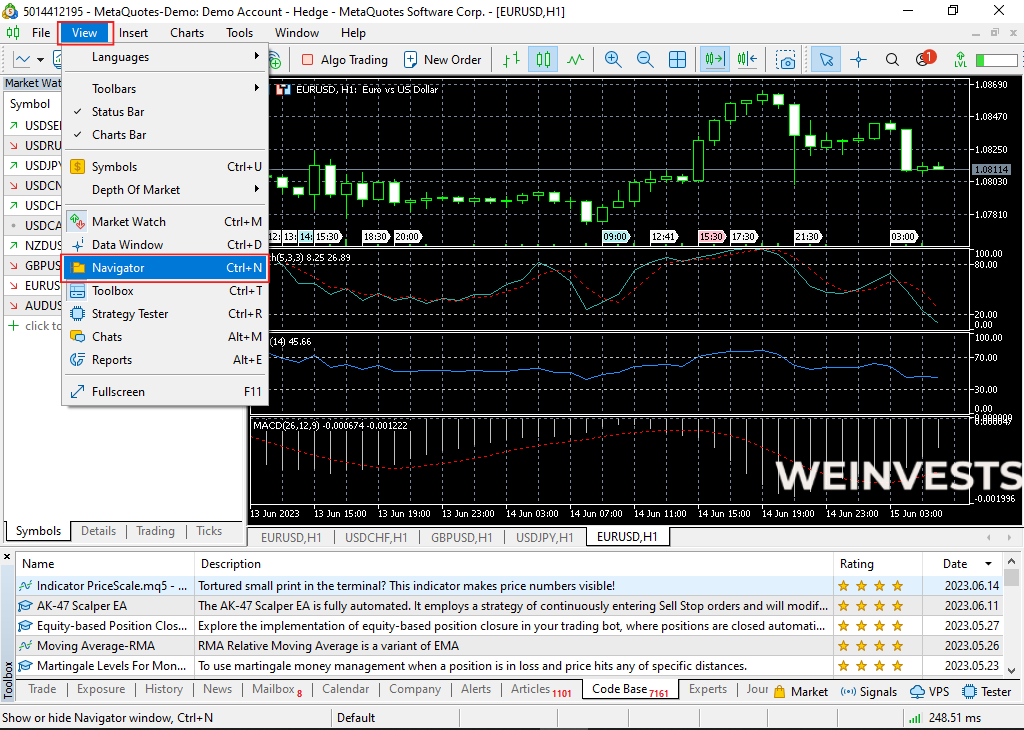
- Return to MetaTrader 4, and open the “Navigator” window by clicking “View” in the menu bar and selecting “Navigator.” Find your custom indicator in the “Custom Indicators” folder, then drag and drop it onto your chart.
Now, the Stochastic + RSI + MACD strategy is integrated into your MetaTrader 4 platform. The process for other platforms will follow a similar pattern: add the individual indicators to your chart, adjust their settings, and create custom alerts or signals using the platform’s scripting language.
The Trick To Using RSI In Your Trading
You can use this technique to determine if a stock is overbought or oversold, and then you can make an educated decision on your next move.
Once you’ve decided which direction you think the price will go, look at the RSI indicator and see what it’s doing. If it’s above 70%, then chances are that there may be more room for growth before hitting resistance levels (this means buying). If it’s below 30%, then chances are that there may be more room for decline before hitting support levels (this means selling).
If you’re looking to buy a stock, and the RSI is above 70%, then you may want to wait until it drops below 70% before buying. This will help you avoid getting caught in a price trap, where the price bounces around between support and resistance levels.
How To Use This Strategy For Day Trading?
The Stochastic, RSI, and MACD strategy is based on the assumption that, over time, the market will go up or down. It works best on a daily chart, but can also be applied to 15-minute time frames.
Let’s take a look at how this strategy works:
- The MACD (Moving Average Convergence Divergence) uses exponential moving averages (EMAs). An EMA is simply an average of prices over a given period of time; it smooths out short-term fluctuations in price so you can see trends more clearly.
- RSI measures how strong or weak a particular asset’s recent performance has been compared with its historical normality level over time periods ranging from one day all the way up through 52 weeks.
Conclusion
The Stochastic + RSI + MACD trading strategy is a popular and effective way to trade the stock market. This strategy is based on three technical indicators and is designed to generate short-term profits. It is important to use the strategy in a risk-controlled manner and to set realistic expectations.
WeInvests is a financial portal-based research agency. We do our utmost best to offer reliable and unbiased information about crypto, finance, trading and stocks. However, we do not offer financial advice and users should always carry out their own research.
Read More