This content represents the writer’s opinions and research and is not intended to be taken as financial advice. The information presented is general in nature and may not meet the specific needs of any individual or entity. It is not intended to be relied upon as a professional or financial decision-making tool.
Fortunately, there are some fairly basic principles you can use to identify when a trend has reversed itself before it’s too late.
Table of Contents
What is a Trend Reversal?
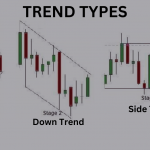
A trend reversal is a change in the direction of the price action. This can be either an upside or downside move, depending on whether you are trading long or short. The most obvious example of a trend reversal would be when an uptrend turns into a downtrend or vice versa.

The most common causes for trend reversals include;
- A breakout from resistance causes traders to take profits and sell their positions (causing the price to drop).
- News events that cause uncertainty among investors and traders alike lead them to exit their positions (causing the price of an asset to drop).
Know the Direction of the Trend
Knowing the direction of a trend is important because it will help you identify support and resistance levels. In addition, knowing which way your favorite trading instrument is headed will help guide your decision-making process when it comes to entering new positions or exiting existing positions.
In order to make the best trading decisions, it is important to know whether a trend is going to reverse in its current direction or continue with more strength. If an asset has been rising steadily over several days and then suddenly drops by 10% in one day (a big move), then it may be signaling that buyers were exhausted and sellers were ready to take over control again; thus, we could expect another rise when these conditions repeat themselves later on during another upward trend cycle.
It’s also important to know if there’s an established trend in place before attempting any reversal trade because these types of trades are often more profitable when they’re entered after prices have broken an uptrend.
Identify the Overbought and Oversold Conditions
You can identify overbought and oversold conditions by observing the price action. For example, if you are analyzing a chart of Apple Inc., AAPL and notice that its price has been declining steadily for several weeks but then suddenly breaks through its 50-day moving average (MA) and continues lower, this could be an indication of an impending reversal since it shows that there was no support near this level.
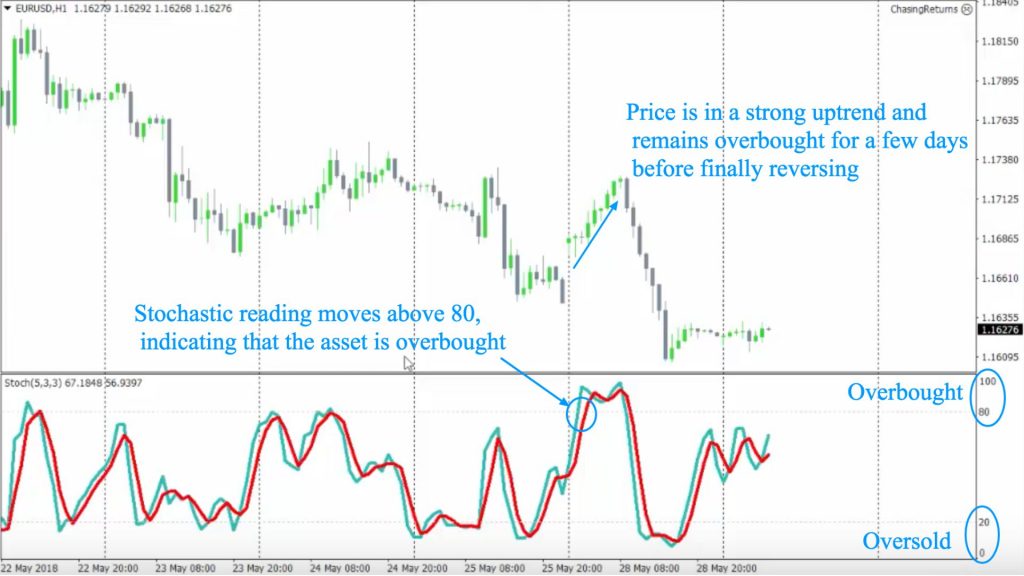
When identifying overbought/oversold conditions in order to spot reversals, look at indicators like MACD (Moving Average Convergence Divergence) and RSI (Relative Strength Index) levels as well as stochastic oscillators such as StochRSI(14). These tools help traders determine whether it may be time for their position to reverse course based on historical data points from previous years where similar conditions existed during prior bull markets or bear markets.
When prices rise above previous highs or lows without resistance from previous levels, that is considered to be an indication of overbought conditions. The logic behind this is that there is no reason why buyers should not keep buying at these levels until they get exhausted, eventually leading up towards the exhaustion point where everyone starts selling off their positions, causing another sharp decline.
Identify Support and Resistance Levels
Identifying support and resistance levels can be a helpful tool when it comes to trading. A support level is a price point where traders expect a reversal in price. The idea is that if the price falls below this level, then there will be an increase in selling pressure. This causes buyers to step back in and buy the asset at a higher price than they did before. This also increases demand for the asset, which causes another increase in price until the original resistance level is re-established.
A resistance level is similar to a support level, but it works in reverse. When the price reaches these points, there will be an increase in buying pressure, and traders will sell at lower prices than before. This decreases demand for the asset, which causes another decrease in price until it reaches its original support level again.
5 Strategies To Identify Trend Reversals
Knowing how to spot market reversals will help you avoid losses and keep your portfolio healthy. This is because reversals are almost inevitable when trading stocks, Forex, or crypto. If you don’t know what causes them or how to spot them, then the next time one happens, it could devastate your portfolio.
Here are five ways traders can identify a market reversal and stay ahead of the curve:
Trendlines
Trendlines connect a series of highs or lows in an uptrend or downtrend and are used as a visual guide to identifying potential reversal points. Trendlines can be drawn using either the high or low prices of a price bar, but whichever one you choose, it’s important that both ends of your trendline are clearly visible on your chart. If they’re not, then there’s a good chance the trendline won’t hold as support or resistance when tested by market participants.
Moving Averages
Moving averages are another tool for identifying trend reversals ahead of time because they show where support or resistance has been in the past and can be used as an indicator for future price movements in both directions. The most commonly used moving averages include 10-day, 20-day, and 200-day moving averages (as well as others), which represent short-, intermediate- and long-term trends, respectively.
Candlestick Patterns
Candlestick patterns are a great way to identify potential turns. There are many different candlesticks, and each one has its own meaning, but most have similar meanings when it comes to reversal patterns. Here are some examples:
Bullish engulfing is a bearish reversal pattern. This pattern forms when a small body candle is followed by a large body candle that completely engulfs the previous small body candle. The smaller body candle must be black and represent a sell-off. The larger body candle must be white and represent an upswing. When this happens, traders view it as a sign of weakness in the market, and that momentum may be shifting away from bears (bulls).
Bearish engulfing is a bullish reversal pattern. This pattern forms when a large body candle is followed by a smaller body candle that completely engulfs the previous large body candle. The smaller body candle must be white and represent an upswing. The larger body candle must be black and represent a downswing. When this happens, traders view it as a sign of strength in the market, and that momentum may be shifting away from bulls (bears).
This pattern signals an impending reversal in price after a strong uptrend. It occurs when there is a large white body followed by another large black body that opens lower than the first one’s close and closes even lower than its open.
This pattern signals that an uptrend may be coming to an end as soon as tomorrow morning, if not already today afternoon, depending on how far apart the bodies are on this particular charting platform, such as TradingView or StockCharts.
Pullback Reversal
Pullback reversals are a common occurrence in the market. They’re often seen at support levels, and they can be identified by looking for price action that shows signs of exhaustion.
The RSI indicator is a good tool for identifying pullbacks because it will often show oversold conditions when prices move down quickly, giving you an opportunity to buy at a lower price than what you would normally pay.
RSI indicator
The Relative Strength Index (RSI) is a momentum indicator that measures the strength of a trend. It’s calculated by taking the average of the closing price over a certain period of time, then comparing that number to its range over another set period. Basically, If you see an RSI reading above 70, it means that your asset has been in an uptrend and is overbought; if it drops below 30 on your chart, then it may be time to sell because your asset has been in a downtrend and might have reached its peak value for now.
Final Notes
You can learn how to identify market reversals before they wreck your portfolio. The first step is knowing the direction of the trend. If you’re trading stocks, this means determining whether stocks are moving up or down in price. For example, if you buy shares of a company and its stock price goes up by $1 per share after your purchase, then that’s considered an upward trend for that particular security (and vice versa).
We hope this article has helped you to identify market reversals before they happen. Remember, the key is preparation, so always keep an eye out for potential turning points in the market and be ready to act on them when they happen.
WeInvests is a financial portal-based research agency. We do our utmost best to offer reliable and unbiased information about crypto, finance, trading and stocks. However, we do not offer financial advice and users should always carry out their own research.
Read More