This content represents the writer’s opinions and research and is not intended to be taken as financial advice. The information presented is general in nature and may not meet the specific needs of any individual or entity. It is not intended to be relied upon as a professional or financial decision-making tool.
3 Simple Indicators That Will Help You Beat The Market

Successful traders know that using the right strategy is only half the battle. The other half is deciding what technical indicators you should use. This guide will cover three simple yet powerful indicators to help you quickly and easily identify trading opportunities.
Table of Contents
- Identifying Market Trends
- The Moving Average Convergence Divergence (MACD) Indicator
- How to setup MACD + Parabolic SAR + 200 EMA on eToro
- MACD, Parabolic SAR, and 200 EMA indicators on TradingView
- Why Traders Should Use MACD?
- How To Use MACD?
- The Parabolic Stop and Reversal (SAR) Indicator
- Why Traders Should Use Parabolic SAR?
- How To Use The Parabolic SAR?
- 200-day Exponential Moving Average (EMA)
- Differences Between EMAs and SMAs
- How to Use the 200 EMA Indicator?
- Using 200 EMA + Parabolic SAR + MACD Indicator
- Trading The 200 EMA + PSAR + MACD Strategy
- Key Takeaways
- Final Note
- FAQ
Identifying Market Trends
Technical indicators are a great way to spot trends and predict future moves in a stock or index. The market is constantly in motion, so investors need to understand how to read the markets and make decisions based on those signals. The Moving averages, MACD, and Bollinger bands are among the most popular technical indicators used by traders today. However, today we will specifically be talking about the MACD, Parabolic SAR, and 200 EMA.
These three indicators go hand-in-hand with each other and produce high-quality trades if used correctly. The first step to using these indicators is finding a trading platform that gives you access.
The Moving Average Convergence Divergence (MACD) Indicator
The Moving Average Convergence Divergence (MACD) indicator is one of the most widely used technical indicators in trading. It was developed by Gerald Appel, who published an article on this topic in the late 1970s.
The MACD is calculated using two exponential moving averages: A short-term and long-term moving average. The shorter-term moving average is subtracted from the longer-term moving average to produce the MACD line. These two lines’ differences represent their crossovers, which are considered signals for market entry and exit points and trend direction changes.
How to setup MACD + Parabolic SAR + 200 EMA on eToro
- Log in to Your eToro Account: Open your eToro account or open a new account.
- Select an Asset: Choose the asset you want to trade from the “Trade Markets” section.
- Open the Chart: Click on the asset to view its chart.
- Access Chart Tools: On the chart, look for an option like “Indicators” or a symbol representing chart tools (often a graph or wrench icon).
- Adding the Indicators:
- MACD (Moving Average Convergence Divergence): Find MACD in the list of indicators and add it to your chart.
- Parabolic SAR: Look for Parabolic SAR in the indicators list and apply it.
- 200 EMA (Exponential Moving Average): Search for EMA in the indicators, select it, and set it to a 200-period for the 200 EMA.
- Adjust Settings: Each indicator might have default settings that you can adjust based on your trading strategy. For example, you may want to set specific time frames or values.
- Analyze the Chart: With the indicators applied, you can start analyzing the asset’s price movements in relation to the indicators’ signals.
- Apply Your Strategy: Use the insights gained from these indicators to inform your trading decisions.
MACD, Parabolic SAR, and 200 EMA indicators on TradingView
- Open TradingView: Go to the TradingView website and log in to your account.
- Select a Chart: Choose the chart of the asset you wish to analyze.
- Adding Indicators:
- MACD (Moving Average Convergence Divergence): Click on the “Indicators” icon at the top of the chart. Search for “MACD” in the search bar and select it from the list to add it to your chart.
- Parabolic SAR: In the same “Indicators” menu, search for “Parabolic SAR” and add it.
- 200 EMA (Exponential Moving Average): Again in the “Indicators” menu, search for “EMA” or “Exponential Moving Average” and select it. Once added, you’ll need to configure it to the 200-period by clicking on the settings icon of the EMA indicator on your chart and changing the length to 200.
- Adjusting and Analyzing: After adding these indicators, you can adjust their settings according to your trading strategy. Analyze how these indicators interact with the price movements to make informed trading decisions.
- Applying the Strategy:
- For a buy signal, look for the price to be above the 200 EMA, the Parabolic SAR to indicate an upward trend (dots below the price), and the MACD delta to be positive.
- For a sell signal, the price should be below the 200 EMA, the Parabolic SAR should show a downward trend (dots above the price), and the MACD delta should be negative.
Remember, while these indicators can provide valuable insights, they are not infallible. It’s always advisable to use additional analysis and risk management techniques.
For more detailed guidance and examples, you can refer to the information on TradingView’s website, where they provide comprehensive explanations and applications of these indicators.
Why Traders Should Use MACD?
Traders use the MACD indicator to determine whether a stock or market has entered a bullish or bearish trend. An upward-sloping MACD line indicates that prices are increasing and may be ready for a bullish move. A downward-sloping MACD line suggests that prices are decreasing and may be prepared for a bearish action. When the lines cross, it can mean an impending change in market direction.
The MACD is one of the most popular technical indicators used by traders because it helps them identify trends while they’re still forming and before they become obvious to everyone else. That gives you an edge over other traders who only have access to this information after the market moves.
How To Use MACD?
First, apply the MACD indicator to the asset chart you want to analyze.
Using a free charting tool like Tradingview, You can use MACD at any time.
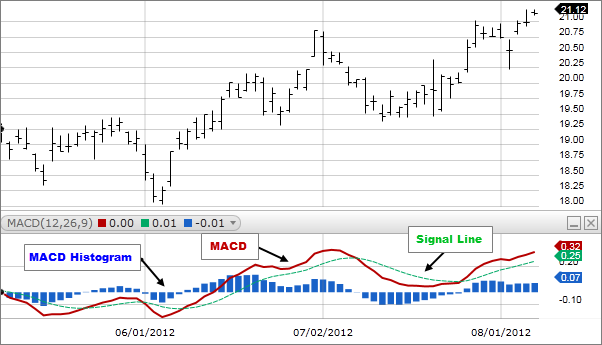
The MACD is calculated by subtracting the 26-period exponential moving average (EMA) from the 12-period EMA. It works best when used in conjunction with other technical indicators like Moving averages, RSI, or Bollinger Bands. The default settings for the short-term and long-term EMAs are 12 and 26, but you can change these according to your preference. The MACD compares the moving average to the signal line and displays this information as a histogram. Traders can use the histogram to identify trends or reversals in price action.
The Parabolic Stop and Reversal (SAR) Indicator
Parabolic SAR is a trend-following momentum indicator developed by Welles Wilder. It’s calculated by taking the price’s exponential moving average (EMA) and then plotting two lines on top of it: one below and another above. The lower line represents support, while the upper line represents resistance. When prices penetrate these two lines in opposite directions, this indicates that there has been an extreme move in either direction and signals a potential reversal in the price direction.
Why Traders Should Use Parabolic SAR?
The Parabolic Sar (or Parabolic Stop and Reversal) indicator can be used to determine when a particular asset is overbought or oversold. Traders can use this information to determine when it’s time to sell an asset and when it’s time to buy an asset.
Parabolic SAR gives traders a more accurate view of when to open long or short positions by tracking changes in price action that occur when market sentiment shifts from bullish to bearish or vice versa.
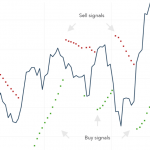
The indicator is a series of dots that appear above and below price bars on the chart. When the dots move closer together, it’s an indication that momentum has slowed and you may want to exit your trade.
How To Use The Parabolic SAR?
First, apply the PSAR indicator to the chart of any assets of your choice.
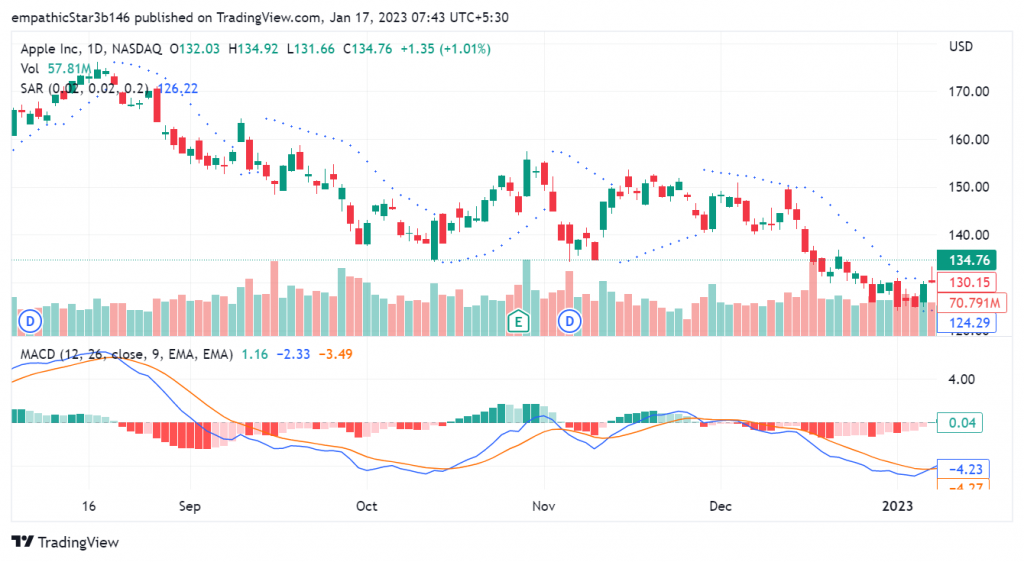
As seen in this example, the Parabolic SAR is denoted as small dots following the price action of an asset. It’s used in conjunction with the MACD indicator, which measures the difference between two moving averages of an asset’s price.
The Parabolic SAR indicator plots dots on a chart in the curve, which allows traders to see how far an asset has moved since its last dot was plotted. If the dots move too far away from each other, then it means that the asset has moved too quickly and might be headed towards a reversal point where traders should consider selling their position. If they move closer together, then it means that there is less volatility in price movement which could indicate that prices are likely going to continue moving upwards before they reverse direction again at some point down the road.
200-day Exponential Moving Average (EMA)
The 200 Exponential Moving Average (EMA) Indicator is a trend-following indicator that can be used to determine the strength of a trend, its direction and momentum.
The 200-day EMA simply means the moving average of the last 200 days. It’s used to smooth out price fluctuations, and it can be found on most trading platforms. The 200-day EMA is used in many technical indicators, including the MACD (Moving Average Convergence Divergence), RSI (Relative Strength Index), CCI (Commodity Channel Index) and Stochastics Oscillator.
Differences Between EMAs and SMAs
EMAs are based on the same principle as moving averages, but they have some distinct advantages over simple moving averages:
They are less prone to whipsaws because they’re smoothed by an exponentially weighted averaging process rather than just being averaged across all time periods equally like in simple moving averages. This means that recent price changes have more influence than older ones when calculating EMA values; this makes them better suited for identifying short term trends instead of long term ones.
EMAs are also more responsive to price changes than simple moving averages, this means that they can quickly identify reversals and support/resistance levels. They have a better ability to distinguish between short term trends and long term ones. EMAs can be used in conjunction with other indicators, such as RSI and MACD.
How to Use the 200 EMA Indicator?
First, apply 200 EMA indicators to any trading chart of your choice. For this example we will be using the BTC/USD daily chart.
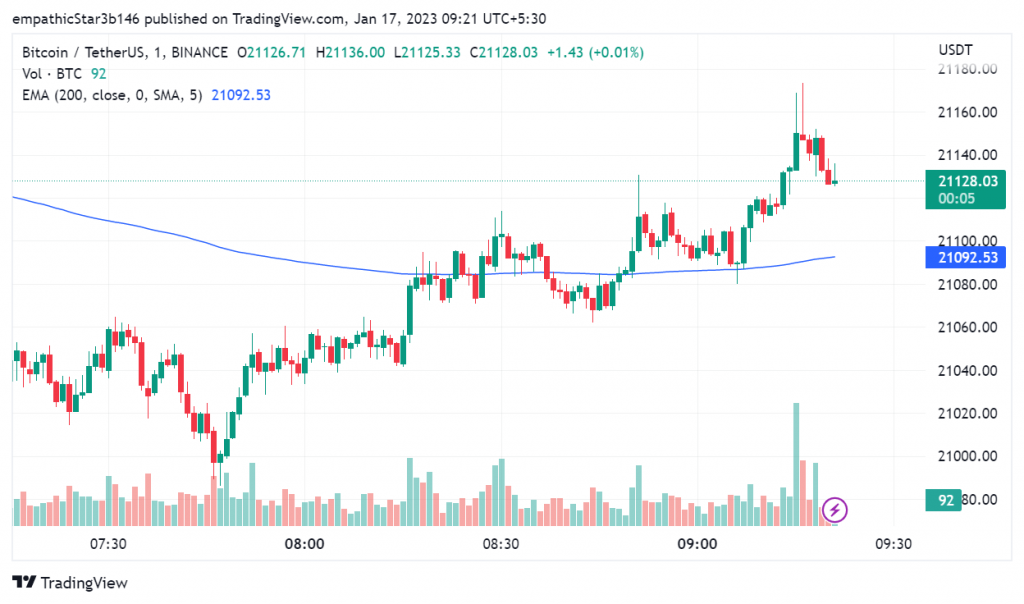
The 200 EMA is a simple moving average that is calculated by taking the closing price of the past 200 days, and then dividing it by 200. This indicator is used to determine if a stock or commodity will continue trending up or down.
When prices are above the 200 EMA (blue line), it means that there has been an uptrend in prices,and when prices are below this line, it indicates that there has been a downtrend in prices over this period of time.
When the 200 EMA is crossed by the price of a commodity, this indicates that the trend has changed and there is likely to be a reversal in price direction. For example, if prices are above the 200 EMA but start trending downward below this line, it means that prices have started falling faster than they were rising before which may indicate that a downtrend has begun.
Using 200 EMA + Parabolic SAR + MACD Indicator
Traders can apply these three trading indicators together on a price chart to form a more accurate prediction of where a trend is headed. To illustrate this, here is a daily chart of the EUR/USD Forex pair.
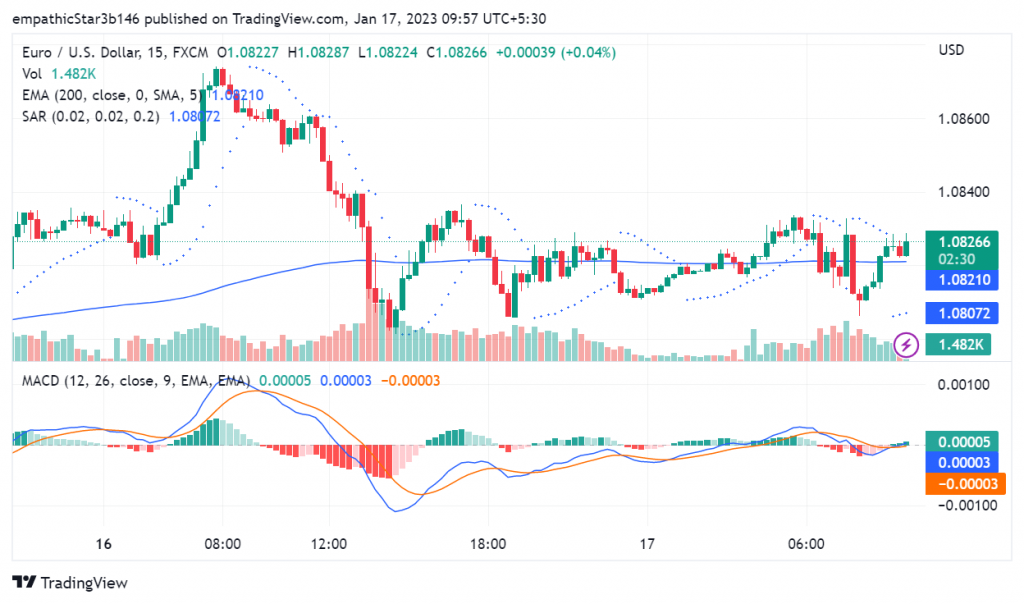
MACD serves as a momentum indicator that helps identify the direction of an asset’s price movement by plotting its values against its signal line, which acts as a trigger for buy or sell signals depending on whether prices are rising above or falling below this line (respectively).
While the Parabolic SAR measures whether markets are trending up or down by looking at their recent behavior relative to their average price levels over time–the greater distance away from those averages means more volatility; conversely, moving closer towards them indicates less volatility within this timeframe.
200 EMA with Parabolic SAR is used to find support and resistance levels, which can be used for entry points.
Trading The 200 EMA + PSAR + MACD Strategy
The way to trade this strategy is by using a trailing stop loss, which will protect gains and help you avoid losses if a trade goes against you. So rather than waiting for both lines on your chart to cross before entering a trade (MACD), use an entry point based on where they actually are at that moment in time instead of waiting for them both to cross over or under each other respectively (200 EMA + PSAR). This will speed up how quickly trades can be made while still protecting profits with a trailing stop loss order placed just under recent highs/lows if the price moves against you after entry into our position.
The other major benefit of this strategy is that it works on all timeframes, and can be used for both long-term and short-term trading. The only thing that changes is the trend following the period. For example, if you use a daily chart to trade this strategy, then you may want to look for a longer timeframe, such as a week or month, rather than just 15 minutes, like we did above.
Key Takeaways
- The MACD indicator is used to measure the difference between the 26-day EMA and the 12-day EMA.
- The Parabolic SAR indicator is used to determine the overbought and oversold conditions of a market.
- The 200 EMA is a powerful tool for technical traders because it can help identify support levels in your trade.
Final Note
In a nutshell, this article is a step-by-step guide to using three simple technical indicators. These indicators are the Moving Average Convergence Divergence (MACD), the Parabolic Stop and Reversal Indicator (SAR), and the 200-day Exponential Moving Average (EMA). They can be used together or separately. This strategy aims to outperform market returns over long periods by identifying the tops/bottoms of stocks, forex, or crypto and trading them accordingly. This approach works best for investors with a longer time horizon than day traders who try to get in and out quickly before the price moves against them.
FAQ
What is the MACD + Parabolic SAR + 200 EMA Trading Strategy?
The MACD + Parabolic SAR + 200 EMA Trading Strategy is a technical analysis approach that combines three different indicators to find profitable trades. The MACD (Moving Average Convergence Divergence) is used to identify trend changes and momentum, the Parabolic SAR (Stop and Reverse) is used to determine entry and exit points, and the 200 EMA (Exponential Moving Average) is used as a support and resistance level indicator.
What is the win rate of this strategy?
According to the web search results, the win rate of this strategy is 70%.[1]
What is the purpose of this strategy?
The purpose of this strategy is to find profitable trades by combining three different indicators: MACD, Parabolic SAR, and 200 EMA. The MACD helps identify trend changes and momentum, the Parabolic SAR helps determine entry and exit points, and the 200 EMA provides support and resistance levels, which can be used as entry points.
- Identify trend changes and momentum
- Determine entry and exit points
- Provide support and resistance levels
What is the recommended way to use this strategy?
The recommended way to use this strategy is by using a trailing stop loss, which will protect gains and help you avoid losses if a trade goes against you.
What type of trading is this strategy suitable for?
This strategy is suitable for day trading, swing trading, and scalping.
WeInvests is a financial portal-based research agency. We do our utmost best to offer reliable and unbiased information about crypto, finance, trading and stocks. However, we do not offer financial advice and users should always carry out their own research.
Read More