What if I told you that drawing a bunch of dots on your stock chart could help make you more money?
You might not believe me, but plenty of traders have found success with this simple tactic. Plotting dots to glean more information from stock charts is the approach used by the technical indicator known as ‘Parabolic SAR.’
The name Parabolic SAR (which stands for Stop and Reverse) might sound intimidating. But when you start using it, you’ll find that it’s actually one of the most intuitive indicators you could possibly use.
The calculations that go into plotting the Parabolic SAR dots are a bit complicated, but you won’t usually have to deal with them. Most trading software will calculate the dots for you automatically.
In this article, we’ll explore Parabolic SAR in detail. We’ll start by providing an in-depth explanation of the indicator, followed by noting some of the key concepts traders will need to be aware of.
Then, we’ll review the strategies that can be used in coordination with this indicator, as well as a real-life case study. By the end, you’ll be well-versed in how to use some simple dots to help make serious money.
Detailed Explanation
The final output resulting from the Parabolic SAR looks simple. After all, it’s just a bunch of dots on a chart.
But in reality, the dots were calculated using a fine-tuned algorithm to be placed in precise locations. These dots can be used to inform trading decisions to help you make the appropriate entries and exits.
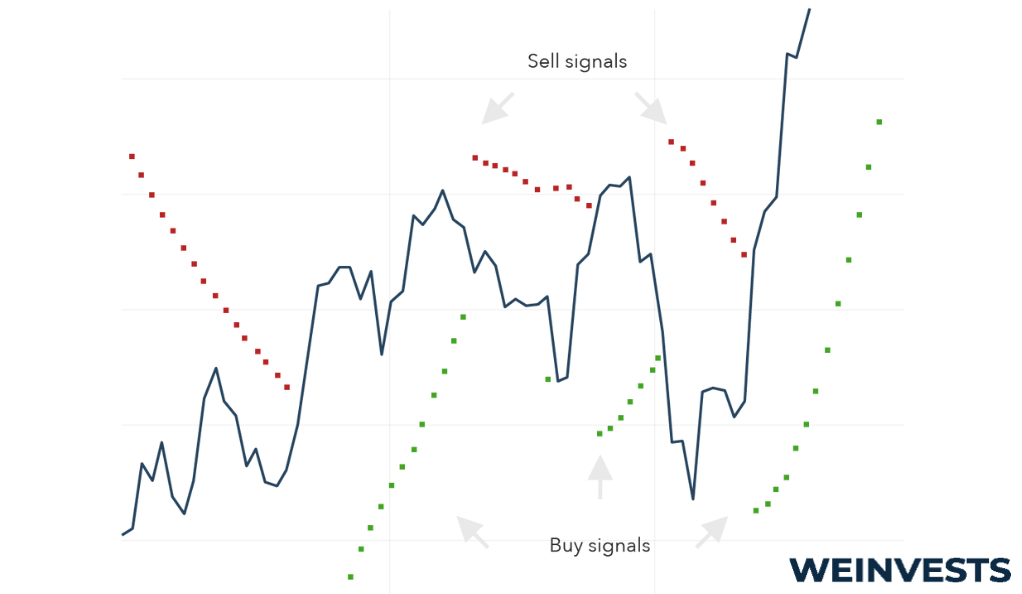
Parabolic SAR is named as such because the dots tend to follow a parabolic curve upward or downward when tracking a trend. The SAR portion of the name indicates what the indicator is supposed to signal: when a trend will stop and reverse.
When an asset is experiencing an uptrend, the SAR dots will usually be placed below the price line. This suggests that the current uptrend has the strength to continue. When the price begins to fall below the dots, however, it’s a signal that the trend could be faltering.
Similarly, an asset experiencing a downtrend will usually have SAR dots above it. As a downtrend weakens, though, the price might break up through these dots. This could indicate a new uptrend beginning.
The actual calculation that goes into the dots is somewhat complex. The Parabolic SAR relies on an iterative updating of its current level at each price point. This means that at each step, the previous dot is used to calculate the next dot.
This updating relies on what is known as an “acceleration factor.” The acceleration factor tends to bring the dot closer and closer to the price line as a trend continues. This means that a trend will need to continue to show great strength to resist a reversal signal.
The acceleration factor is what creates the parabolic in Parabolic SAR. It also matches our intuition that a trend tends to get weaker over time. Therefore, as a trend continues, it makes sense to be more sensitive to potential reversals.
Keeping a close eye on trends, though, is not enough to fully utilize this indicator. You’ll also need to understand some key concepts about trading to effectively profit from its use.
Key Concepts
The Parabolic SAR is not a comprehensive trading solution. While many traders find its intuitive nature attractive, you’ll need to grasp these major concepts in order to leverage the full value of this indicator.
Trend, momentum, and reversals
The Parabolic SAR is used to monitor the existence of trends and when those trends might reverse. In doing so, it aims to help traders pick when they will enter and exit trades.
This means that traders will need to have a clear understanding of the concept of trends and reversals.
Trends are simple enough to grasp in theory but may be difficult to identify in practice. An uptrend is a period of rising prices, although it could play out across different timescales. Conversely, a downtrend is a time of falling prices.
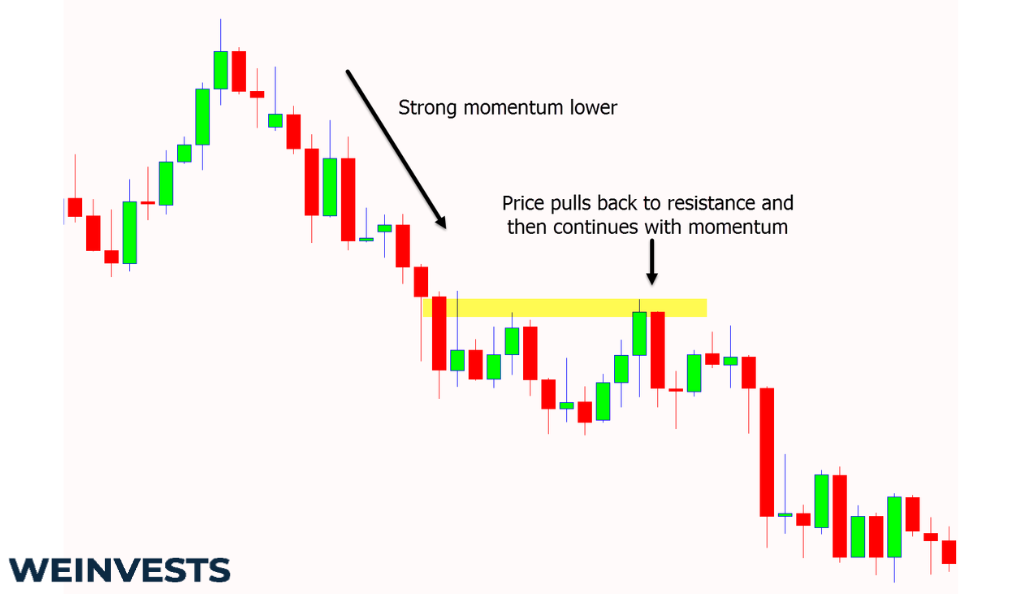
Momentum denotes the strength of a trend. If a trend has strong momentum, we can expect it to continue for a while. If there is weak momentum, however, it could indicate a potential reversal incoming.
A reversal is the moment in which an uptrend or downtrend evaporates. This could lead either to the opposite trend or to a choppy market going nowhere in particular.
Identifying market types
As the last section indicated, there are different types of markets in practice. And no, we don’t just mean stock markets, bond markets, and crypto markets.
Instead, a market type denotes the trend-like behavior on display in a market. Some markets go through constantly fluctuating trends, oscillating between boom-and-bust periods. This manifests as uptrends being followed by downtrends, or vice versa.
Rarely, markets might be going straight up or straight down. Less rarely, though, is a choppy market that ‘trades sideways.’
[“A graphic showing two markets: one with significant up and down trends, the other with small choppy movements. Each labeled appropriately”]
A choppy market has no clear, identifiable trend. Instead, it bounces along around some price level.
A market with identifiable trends can be good for Parabolic SAR traders since it provides plenty of opportunity to enter and exit trades profitably. A choppy market, though, will give off plenty of false signals.
This is why it’s so important to identify the market you’re in. If the market seems too choppy, be skeptical of any signals thrown off by the Parabolic SAR.
Parabolic SAR Strategies
Once you can identify a trending market and understand the concepts of momentum and reversals, you’re close to being able to put Parabolic SAR into practice.
In this section, we’ll cover some very common trading strategies that this indicator is used for.
Trend following
Trend following is exactly what it sounds like: following an existing trend in the hopes of profiting from it.
Parabolic SAR plays an important role in trend following because it can inform you precisely when to get out of the trend. When the price level crosses the dots, that’s usually a sign of a potential reversal incoming.
Many traders look to extra confirmation of a reversal from other indicators. Because of its design, however, Parabolic SAR is almost uniquely suitable to support trend following.
Stop losses
Another popular trading strategy associated with Parabolic SAR is the use of stop losses.
A stop loss is a predetermined exit point for a particular trade. For instance, suppose you purchase TSLA at $250. While you might be bullish on your investment, you also want to automatically exit the trade if things get rough.
Therefore, you set a stop loss at $220. This will automatically sell the stock for you if that price is reached.
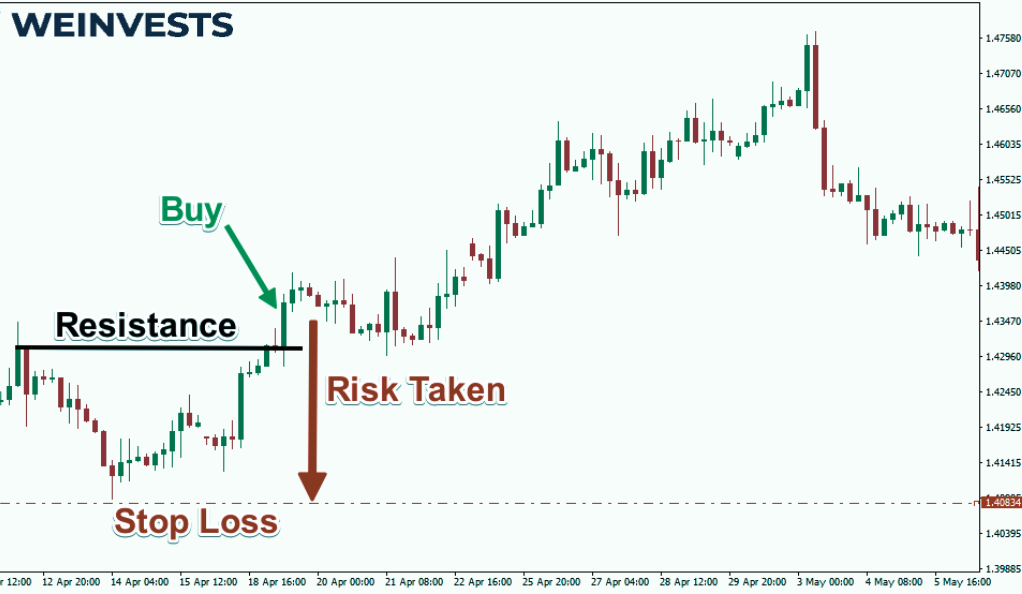
The Parabolic SAR has a built-in stop-loss indicator in the form of dots. When the price level reaches these dots, it could be a sign that bad things are coming, including a potential reversal.
Therefore, many traders will use the Parabolic SAR to automatically update their stop losses over time. This can give traders the confidence to play certain trends while knowing they can easily and intelligently exit their positions if the trade goes against them.
Case Study
Let’s take a look at a case study that incorporates both trend following and stop losses.
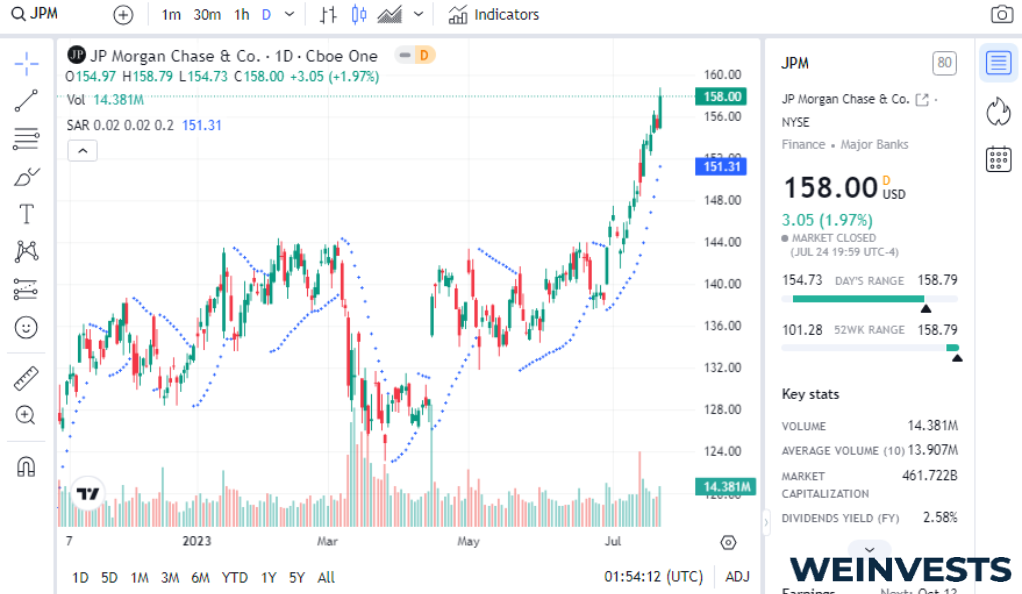
- Identify the stock with a clear trend: Since the Parabolic SAR dots are so easy to read on a chart, it makes it simple to sort through many different stocks to find one with a good trend. Let’s say we’ve identified a strong uptrend on JPM.
- Determine entry point: If it looks like the dots are far from the price line, we should be in a good position to enter the trade. It’s important to identify a trade early, so the acceleration factor has not brought the dots too close to the price line.
- Enter stop loss: Once we’ve made our purchase, we likely want to enter a stop loss based on the distance from the dots to the price line. As the trend continues, we might consider adjusting our stop loss level over time.
- Monitor the trade: Trend following requires some diligence in that you will have to monitor how the price is developing. Sudden market shifts might require a quick exit from the position.
- Determine exit point: Suppose that the price of JPM has been rising for a while, bringing the dots in a parabolic arc close to the price line. This might indicate a weakening of the trend and a potential sign of a reversal. After confirming with another indicator, this might be a good time to sell.
- Identify the next trend: Now that we’ve taken our profit, we can analyze where the market is going next. If it turned out that the market was truly reversing, it’s possible to profit from a downtrend by taking a short position. If the market looks choppy, though, we’ll want to avoid taking a new position.
Any trading strategy comes with potential risks. We’ll turn to those next.
Potential Risks
While Parabolic SAR can be powerful, you should be mindful of the risks inherent in using this indicator. We’ve summarized some of the key risks below.
- False Signals: No signal is guaranteed to predict a reversal. Even if the price line comes in contact with the dots, the trend could very well continue. As the acceleration factor grows, this could become an even more severe false signal.
- Choppy markets: Closely related to false signals is the risk of trading in a choppy market. As we outlined before, the Parabolic SAR is not suitable for markets without identifiable trends. The indicator will generate plenty of signals, but they won’t be actionable.
- Illiquid markets: For markets without sufficient liquidity, it’s difficult to trust the signals that Parabolic SAR gives off. This is because illiquid markets, characterized by low volume, can have significant price swings in a short amount of time. This renders the dots less informative.
While these risks should be recognized, traders should remember that all technical indicators come with risk. The key is to find an indicator whose risks align with your own, individual trading style.
Conclusion
In this article, we’ve most of the important information relating to the Parabolic SAR indicator. Given the complex equations that the simple dots hide, though, there is more depth to study.
With that being said, this information should be enough to get a trader started using Parabolic SAR. So long as the indicator is used in an appropriate market, it can be a powerful driver of trend-following strategies or used as a supplement for placing appropriate stop loss trades.
Like all indicators, using Parabolic SAR comes with certain risks. If these risks are properly managed, though, the tool can be incredibly effective. If you’re skilled at using it, this indicator might just help your profits go parabolic.
FAQ
What are the best Parabolic SAR settings?
The main setting that traders can adjust when using Parabolic SAR is the acceleration factor. Most traders will find that the standard setting of .02 is appropriate. You can also set a maximum factor, which is typically .20. Over time, you’ll develop a system that works for your trading style.
How to calculate SAR?
Calculating the Parabolic SAR dots is a complicated, iterative process. For this reason, your best bet is to let your trading software chart the dots for you. Luckily, this indicator is popular, so most trading packages should include the associated calculations.
How to trade forex with Parabolic SAR?
Trading forex is a very popular way to Parabolic SAR. Most forex markets are deep, liquid, and with strong trends, making it a good environment for using the indicator. Like using the indicator in all markets, ensure you identify clear entry and exit signals, and consider using a stop loss to manage your risk.
WeInvests is a financial portal-based research agency. We do our utmost best to offer reliable and unbiased information about crypto, finance, trading and stocks. However, we do not offer financial advice and users should always carry out their own research.
Read More