Trading in the financial markets is as much an art as it is a science. This delicate balance between intuition and knowledge can significantly determine the profitability of your trades. One of the many trading concepts that can contribute to this critical balance is the cup and handle pattern. It’s a technical chart pattern that signifies a bullish trend, leading traders to potentially profitable opportunities. This article aims to shed light on mastering the cup and handle pattern for effective trading.
The purpose of this article is to provide you with a comprehensive understanding of the cup and handle pattern, the insights it offers into the market, and how traders can leverage it for profitable trading. As we delve into the intricacies of this chart pattern, we’ll uncover key concepts, discuss detailed strategies, and analyze real-life case studies to bring a pragmatic approach to this theoretical knowledge. We will also examine potential risks and considerations you must be aware of when using this trading tool.
What is the Cup and Handle Formation?
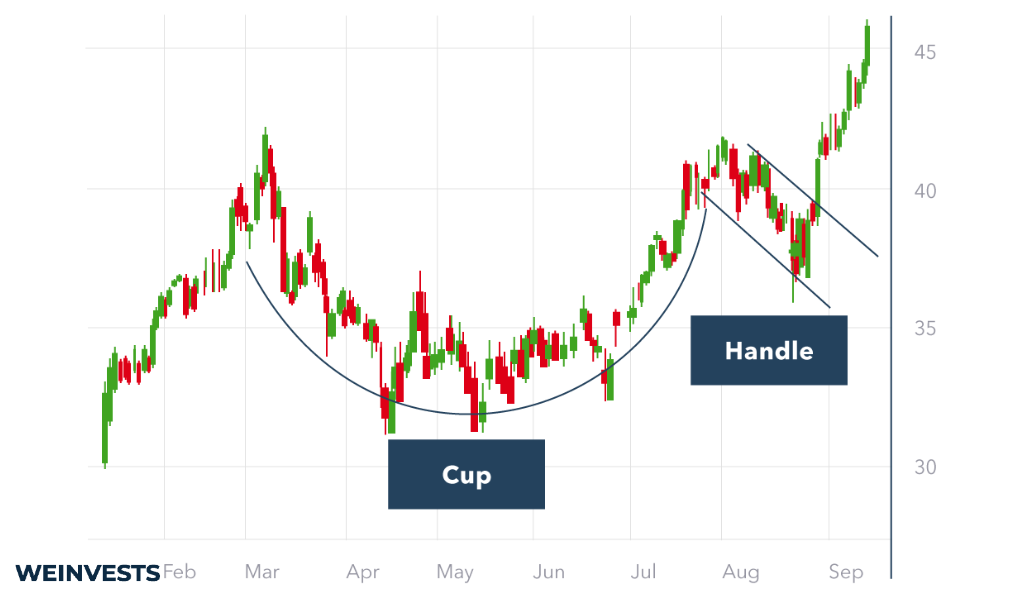
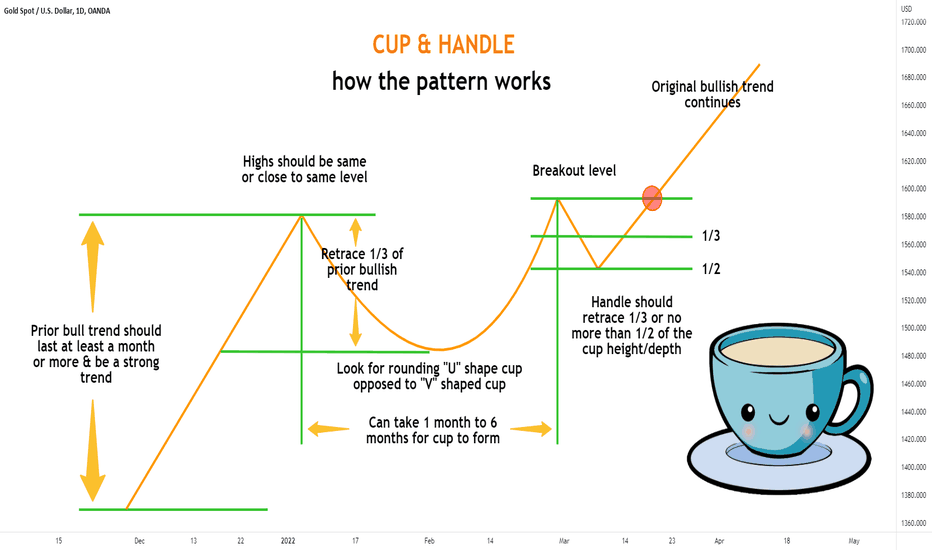
The cup and handle pattern, conceptualized by William O’Neil, is a trusted technical analysis tool among traders for predicting potential bullish breakouts. The pattern consists of the following key elements:
- Cup Formation: Resembling a teacup when viewed from the side, the pattern starts with a ‘U’ shaped formation known as the ‘cup.’ This phase is primarily a product of market consolidation or profit-taking activities. Selling pressure leads to a drop in price, forming the first half of the cup. As selling pressure diminishes and buyers regain control, the price starts to climb back up, completing the second half of the cup. The cup represents an extended pause in trend movement, either a pause in a prevailing uptrend or a period of consolidation during a downtrend.
- Handle Formation: Following the cup, there is a minor downward or sideways movement forming the ‘handle.’ The handle is smaller in time duration and size compared to the cup. It may represent a final shakeout of weak hands before the price makes its upward break, or it could be a continuation of the consolidation, as the market catches its breath before the next move.
When trading this pattern, it’s essential to watch for the following confirmation signals:
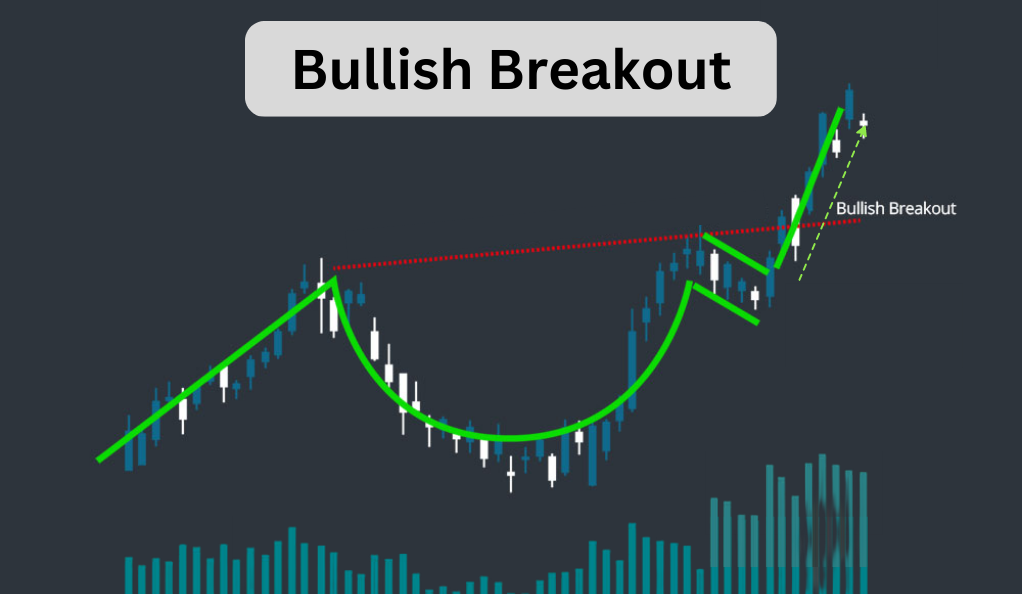
- Bullish Breakout: When the price breaks out from the handle’s resistance level, it’s usually an indication of the beginning of a strong bullish trend.
- Volume Confirmation: The breakout should be accompanied by an increase in trading volume, providing additional confirmation of the pattern’s validity.
Additional points to consider:
- Time Frame: The time frame for the cup’s formation can range from several weeks to many months, depending on the asset and market conditions.
- Depth and Shape: The cup should be relatively shallow to moderate in depth, and the ideal formation is smooth and rounded, not V-shaped, as sharp movements tend to represent volatility rather than a balanced shift in market sentiment.
The cup and handle pattern has proven effective over decades and is widely employed by technical traders for identifying potential bullish opportunities.
Understanding the Cup and Handle Key Concepts
The mastery of the cup and handle pattern lies in the understanding and recognition of its two main components: the cup and the handle. Here are the key features and characteristics of each component:
The Cup
- Represents a gradual change in market sentiment from bearish to bullish.
- Starts with the price dropping from a peak, forming the left side of the cup.
- Reaches a trough where the selling pressure eases off, forming the bottom of the cup.
- Increases again to the level of the initial decline, forming the right side of the cup.
- Ideally, the cup is a rounded ‘U’ shape, indicating a gentle and measured transition in market dynamics.
- Steep or sudden price movements can suggest an unstable market, leading to potential false breakouts.
The Handle
- Follows the formation of the cup and represents a minor retracement or consolidation period.
- The price movement during the handle phase is typically a downward or sideways drift.
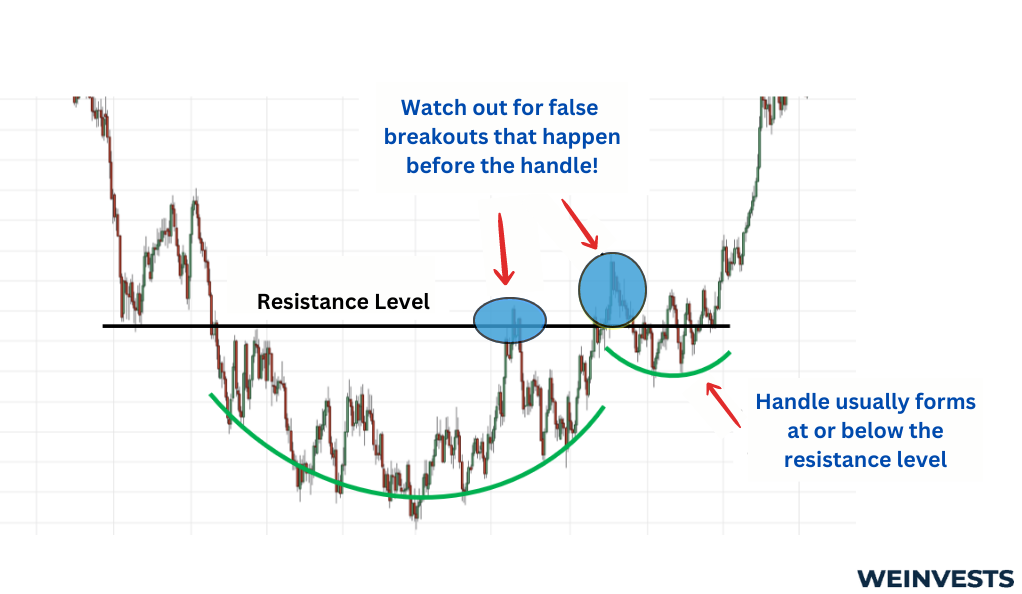
- The handle should not retrace into the lower half of the cup to maintain the pattern’s integrity.
- The completion of the handle often presents a potential trading opportunity.
- It usually precedes a price breakout to the upside, signaling a continuation of the prior uptrend or the start of a new uptrend.
Understanding these components and their ideal characteristics is essential for traders seeking to effectively identify and trade the cup and handle pattern. Mastering the nuances of this pattern allows traders to make more informed decisions and capitalize on potential bullish trends in the market.
How to Trade the Cup and Handle
[Real-Life Price Chart of Cup and Handle with Predicted Move Using Arrow]Trading based on the cup and handle pattern involves meticulous chart observation, precise timing, and disciplined risk management. This powerful, yet straightforward strategy primarily revolves around pattern identification, trade execution, stop-loss orders, and setting profit targets. Here are the key steps and considerations in trading the cup and handle pattern:
Pattern Identification:
- Identify the cup and handle pattern in the price chart of an asset.
- Look for a smooth and rounded cup shape followed by a small consolidation period or a minor price retracement forming the handle.
- Ensure the handle doesn’t retrace more than half of the cup’s advance.
- Observe volume patterns, which generally tend to decrease as the cup forms, increase at the end of the cup, and decrease again during the handle formation.
Trade Execution:
- Place a buy order just above the handle’s resistance level to participate in the potential upward price breakout.
- Wait for the price to break above the resistance level rather than anticipating it.
- Look for an increase in volume accompanying the breakout for additional confirmation of the bullish trend’s strength.
Setting Stop-Loss Orders:
- After executing the trade, place a stop-loss order below the lowest point in the handle or under the handle’s trend line to protect against potential losses if the price moves against the expected direction.
- Allow some room for normal price volatility to prevent the stop order from being triggered by random price fluctuations.
- If the price falls into the lower half of the cup, it may suggest bearish sentiment still dominates, and exiting the trade might be the safer option.
Setting Profit Targets:
- Use the ‘minimum measuring technique’ suggested by William O’Neil, the pioneer of the cup and handle pattern.
- Measure the depth of the cup, i.e., the distance from the right peak of the cup (excluding the handle) to the bottom of the cup.
- Project this distance upwards from the breakout point (the resistance level) to determine a minimum target for the breakout’s potential extent.
In conclusion, trading the cup and handle pattern is a methodical process that requires pattern recognition skills, strategic trade execution, disciplined risk management, and prudent profit target setting. Like any trading strategy, it requires practice and experience to master, and while it’s not foolproof, it offers a systematic approach to capitalize on potential trend continuations.
Real-life Cup and Handle Examples
To provide real-world context to our discussion, let’s examine a couple of case studies of significant chart patterns. Here are the details of the case studies with relevant information highlighted in a bulleted list:
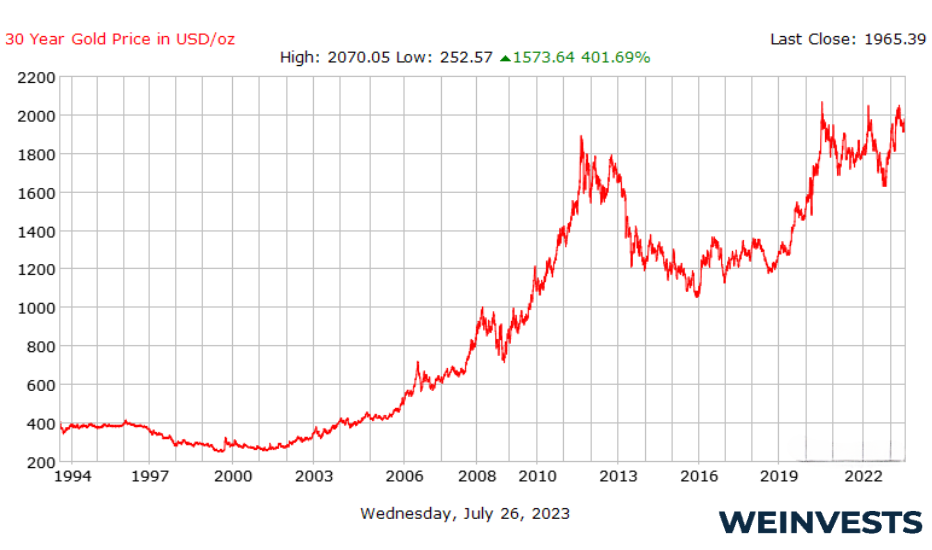
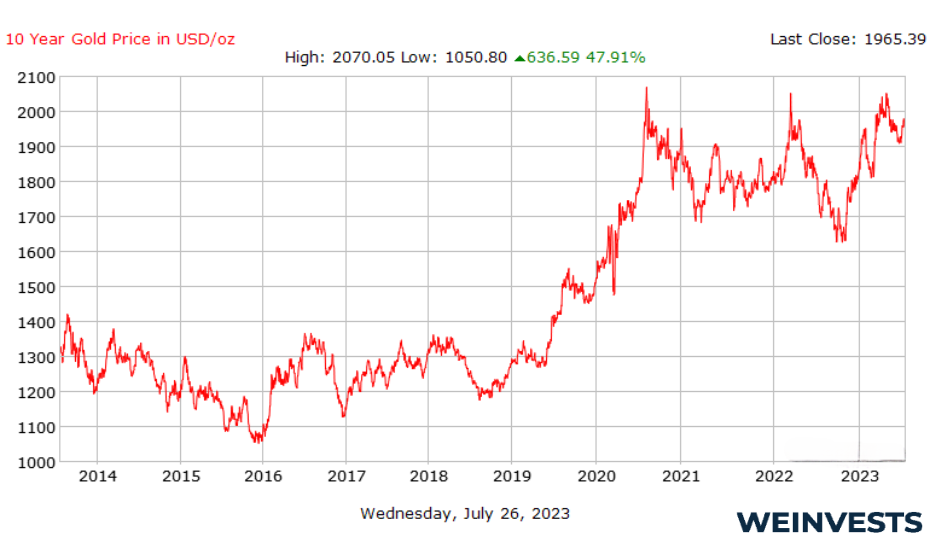
Gold – Cup and Handle Pattern (August 2011 to July 2023)
- Formation of a multi-year cup and handle pattern in the gold price.
- Process began with a fall from the 2011 high, forming the left side of the cup.
- Over several years, gold reached its low, forming the cup’s bottom.
- The price then started ascending, forming the right side of the cup.
- Presently, gold has surpassed the 2011 high, confirming the completion of the cup.
- A handle is still being formed, with a slight downward or sideways drift in the price.
- Traders and investors closely monitor this handle formation, anticipating a potential breakout to a new long-term high.
- The strategic potential of the cup and handle pattern in long-term investments is exemplified by the patient observation and analysis over a prolonged period.
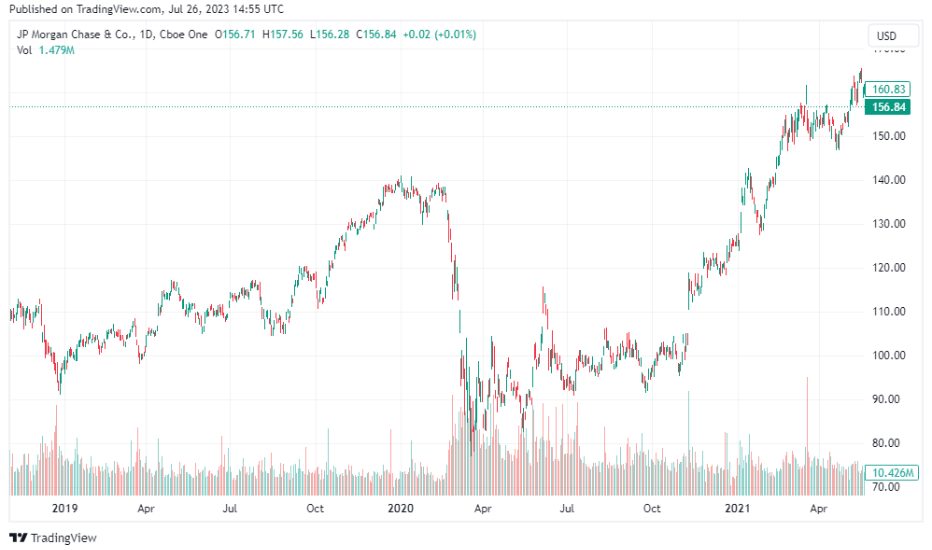
JPMorgan Chase & Co. (JPM) – Cup and Handle Pattern (December 2019 to February 2021):
- Clear cup and handle pattern exhibited by JPM from December 2019 to February 2021.
- After reaching an all-time high in December 2019, the stock experienced a steep drop due to the global COVID-19 pandemic.
- JPM’s stock price traced the left and bottom of the cup over several months, mirroring the market trend.
- By January 2021, the stock returned to its previous high, completing the right side of the cup.
- A brief pullback occurred subsequently, forming the handle.
- JPM’s stock then broke out, rising even higher, confirming the bullish cup and handle formation.
- This case study demonstrates the pattern’s relevance, even in times of unprecedented market turbulence like a global pandemic.
Weighing the Potential Risks and Limitations of the Cup and Handle
Trading with the cup and handle pattern, like any other technical analysis tool, comes with its share of risks and limitations. Traders need to be aware of these to make informed and effective decisions.
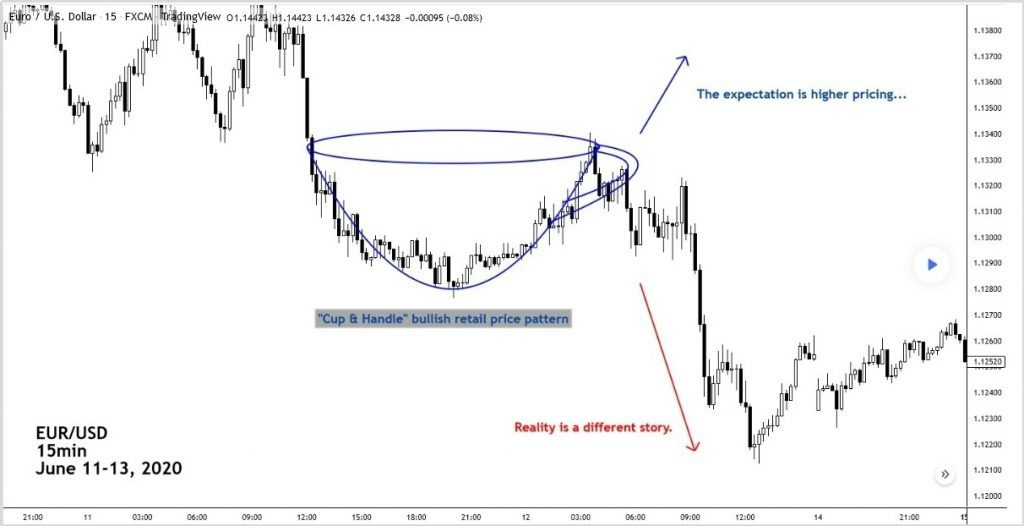
False Breakouts
One of the primary risks associated with the cup and handle pattern is false breakouts. This phenomenon occurs when the price appears to break out above the handle’s resistance level, luring traders into entering a trade, but then reverses direction and moves downwards. False breakouts can lead to significant losses, especially for traders who make aggressive entries without waiting for additional confirmation.
The key to avoiding this pitfall lies in confirming the breakout. The high trading volume during the breakout is a strong confirmation signal; it shows increased participation and interest in pushing the price higher. In addition to volume, traders may use other technical indicators such as the Relative Strength Index (RSI) or Moving Average Convergence Divergence (MACD) to confirm the breakout’s validity.
Subjectivity in Pattern Identification
The cup and handle pattern identification can be highly subjective, presenting another notable limitation. The pattern’s formation rarely matches textbook illustrations perfectly in real-world trading scenarios. Variations in the shape of the cup, depth, duration, and asymmetry between the two sides of the cup can make it challenging to accurately identify this pattern amongst the “noise” of the market. Some traders may see a cup and handle where others see only random price movement.
This subjectivity can lead to interpretational errors and potential losses. To mitigate this, traders should practice pattern identification in different market contexts and use supplementary tools and indicators to provide additional confirmation.
Bullish Bias
Finally, it’s important to remember that the cup and handle pattern has a bullish bias. That said, a reverse cup and handle would have the opposite bias (bearish) as it is the same pattern just upside down. In either case, it is important to understand the directional bias. A traditional cup and handle is essentially a continuation pattern that signals the potential for an existing or emerging uptrend to continue after a period of consolidation. As such, it doesn’t provide insights into potential downtrends or help predict when a bullish trend might end. Traders relying solely on the cup and handle pattern may therefore miss signs of market reversals or bearish trends.
In short, while the cup and handle pattern is a powerful tool for predicting potential bullish breakouts, it is not a standalone solution. Traders need to consider these risks and limitations, apply prudent risk management, and incorporate other technical analysis tools and indicators into their trading strategy for the best results. A well-rounded trading approach that factors in the overall market context, fundamentals, and multiple technical signals tends to be the most effective in navigating the complexities and uncertainties of financial markets.
Final Thoughts
Mastering the cup and handle pattern can prove to be a highly beneficial tool for traders. It is a versatile pattern that not only suggests the potential direction of price but also provides practical entry and exit points. However, it’s not without its risks and challenges. Traders must be mindful of false breakouts and the inherent subjectivity in identifying these patterns.
With the rise of algorithmic trading and machine learning, the future of the cup and handle pattern looks promising. As computers become better at identifying these patterns quicker and more accurately than humans, this could lead to even more trading opportunities. However, human intuition and wisdom will always play a vital role in trading, further proving the importance of mastering such patterns.
As we step into the future, the intricate dance between human traders and AI continues to evolve, leading to exciting developments in the world of financial trading. Nevertheless, the classic cup and handle pattern, with its simple elegance and powerful implications, is here to stay, guiding traders through the market’s ebbs and flows.
FAQ
Can the cup and handle pattern be used for short-selling or bearish trades?
The cup and handle is inherently a bullish pattern, used to predict the continuation of an uptrend after a period of consolidation. It does not provide insights into potential downtrends or indicate optimal points for short-selling. While there’s an inverse variant of this pattern known as the ‘reverse cup and handle,’ it’s less common and considered less reliable by many traders.
How do I set a target price when trading the cup and handle pattern?
The target price in a cup and handle formation can be estimated using a method known as the ‘minimum measuring technique.’ This method involves measuring the depth of the cup, from the peak (right side of the cup, excluding the handle) to the bottom. This distance is then added to the resistance level (the top of the handle) to give the minimum target price for the breakout.
What is the significance of volume in the cup and handle pattern?
Volume plays a crucial role in validating the cup and handle pattern. Typically, volume decreases as the cup forms and increases towards the right side of the cup, signaling that buyers are starting to regain control. Volume may decrease again during the handle’s formation. An upward breakout from the handle on high volume provides further confirmation of a potential bullish trend.
WeInvests is a financial portal-based research agency. We do our utmost best to offer reliable and unbiased information about crypto, finance, trading and stocks. However, we do not offer financial advice and users should always carry out their own research.
Read More