This content represents the writer’s opinions and research and is not intended to be taken as financial advice. The information presented is general in nature and may not meet the specific needs of any individual or entity. It is not intended to be relied upon as a professional or financial decision-making tool.
If you’re new to the world of trading, then it’s likely that you’ve heard about swing trading. Swing trading can be a great way to maximize profits in Bitcoin trading. In this article, we will discuss the benefits of swing trading and how to identify swing trading opportunities in Bitcoin.
What is Swing Trading?
Swing trading is a popular trading strategy amongst investors. It involves holding a stock for a few days or weeks to capitalize on short-term price movements. Swing traders use a variety of strategies to identify potential opportunities and take advantage of them for profits. It also uses technical indicators to identify entry and exit points.
The goal of a swing trader is to capture gains on the short-term price swings in the market without having to constantly monitor his or her portfolio. The most common time frame for a swing trade is one to two days, but it can be as little as 30 minutes or as long as several months.
Swing traders are generally more nimble than day traders. They tend to spend less time watching their positions and more time finding new opportunities. They also tend to use technical analysis tools such as chart patterns and indicators to help them find stocks with the potential for big price moves.
Swing Trading Vs Day Trading: Differences And Similarities
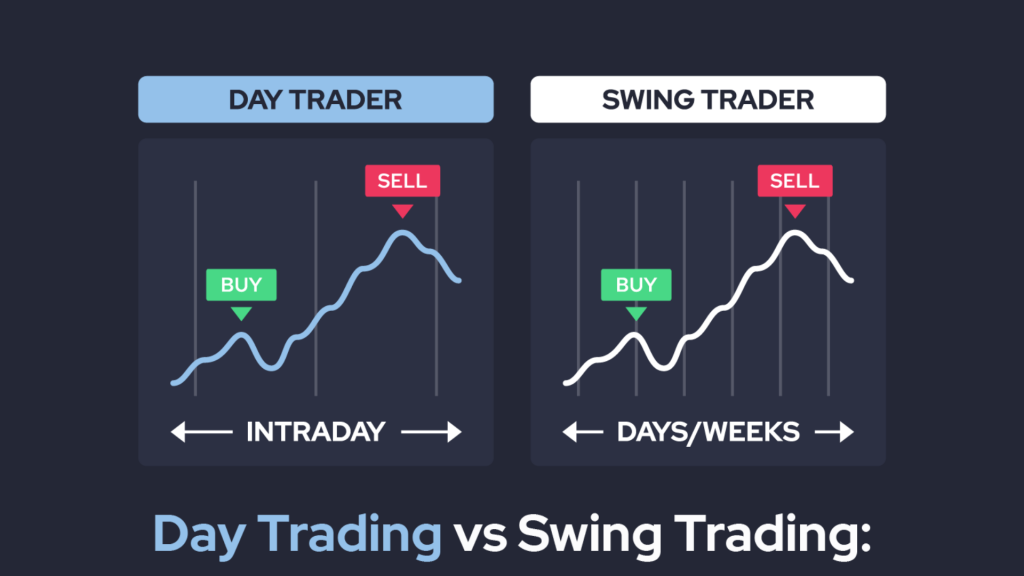
Day trading and swing trading are two types of trading that can be done in any financial market. These are different forms of trading that have different time frames, strategies, and goals.
Day trading is a type of active trading that involves buying and selling financial instruments within the same day. Day traders are generally trying to make money on the fluctuations in the price of a security over the course of a single day. Swing trading, on the other hand, is similar to day trading but has a longer time frame.
Swing trading differs from day trading because swing traders often hold positions for several days to several weeks. This allows them to get in or out of positions before major news events or economic reports come out. Day traders tend to have their positions open for less than a day because they don’t want to be exposed to risk for too long if there’s an unexpected change in market conditions or an unexpected piece of news that could impact their position negatively.
How to Identify Swing Trading Opportunities in Bitcoin?
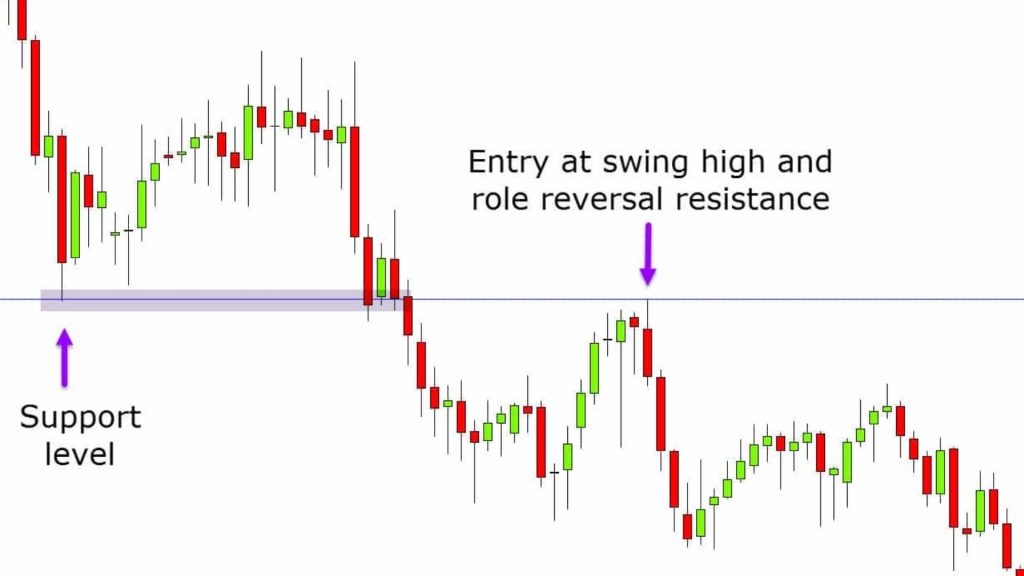
Identifying swing trading opportunities in Bitcoin requires an understanding of technical analysis. By looking at price charts, traders can identify patterns and indicators that can be used to predict price movements. For example, traders can use support and resistance levels, trend lines, and chart patterns to identify potential swing trading opportunities.
In addition to technical analysis, traders can use fundamental analysis to identify swing trading opportunities. Fundamental analysis involves looking at the underlying factors that drive the price of Bitcoin. This could include news events, economic data, and other macroeconomic factors. By looking at these fundamental factors, traders can identify opportunities to buy and sell Bitcoin based on the underlying fundamentals.
Profitable Swing Trading Strategies for Bitcoin
There are a variety of swing trading strategies that can be used to trade Bitcoin. The most popular strategies include Breakout swing trading, Fading trading strategy, trend trading, and range trading.
Trend trading:
Trend trading
is a strategy that involves taking advantage of established trends in the market. By buying when the price is trending upwards and selling when it is trending downwards, traders can capitalize on the momentum of the market.
Range trading
Range trading is another popular strategy that involves taking advantage of price ranges. By buying when the price is low and selling when it is high, traders can capture profits from the market’s volatility.
Breakout swing trading
Breakout swing trading is a strategy used to identify stocks that are beginning to trend in a particular direction. This strategy involves buying a stock as soon as it breaks out of a trading range. The idea behind this strategy is to capitalize on the momentum of the stock as it moves in the desired direction. Traders usually set a target price in order to determine when to sell the stock.
Fading trading strategy
Fading trading strategy is a method of shorting a stock as soon as it has reached a new high. The idea behind this strategy is to take advantage of the market’s tendency to overreact to news and events. By selling the stock as soon as it reaches its peak price, traders can profit from the price fall that usually follows. This strategy is best used when there is no clear trend in the market.
No matter which swing trading strategy you use, it is important to use proper risk management techniques. This includes setting stop-loss points and taking profits as soon as possible. Additionally, it is important to remember that swing trading is a short-term strategy, and it can be difficult to predict the direction of a stock in the long term. As such, it is important to always take into consideration the market conditions and the fundamentals of the stock before making any trades.
Technical Analysis Indicators to Use For Swing Trading
To succeed at swing trading, you need to know what indicators are best suited for this type of trading style. Here are some of the most commonly used indicators in swing trading:
Ichimoku Cloud Indicator
The Ichimoku cloud indicator is one of the leading indicators in the world, and many traders use it. The indicator helps you to forecast the trend and make your trading decisions accordingly. It has been tested over time, and it has proven to be effective in making correct predictions about market movements. The most important thing about this indicator is that it provides you with signals which help you to identify the direction of future price movements.
The Ichimoku cloud indicator can also be used for identifying support and resistance levels, which are very important elements of any trading strategy or system.
In order to use this indicator successfully, you need to understand how it works and what information it provides to traders. Here is an example of how to use this indicator in detail below:
For example, here’s a BTC/USD chart using the Ichimoku Indicator.
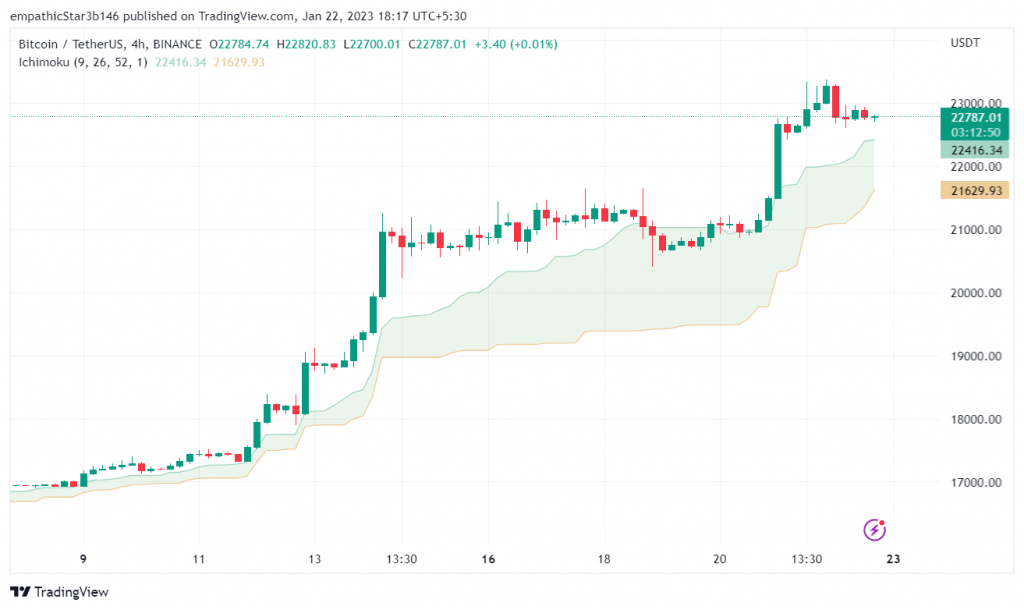
To use the Ichimoku indicator for your swing trading strategy, you will need to adjust the settings of your indicator. First, go to settings, then tick off all the boxes except Lead 1 and Lead 2. Also, you’ll need to change the displacement value to 1. This leaves us with the Kumo cloud, which consists of two lines. The green line is called Lead A, and the Yellow line called lead B.
If prices are above the cloud, it indicates that the market is in an uptrend, and if the prices are below the cloud lines indicates that the market is on a downtrend. Traders should bear in mind that the Ichimoku Indicator is used to take only Long positions.
For your entry signal,
The green price candle should be above the green line (Lead A), and the green line should be above the red line on the chart.
While for your exit signal,
When a red price candle forms below the green line, this should be your signal to close your position.
Bollinger Bands Indicator
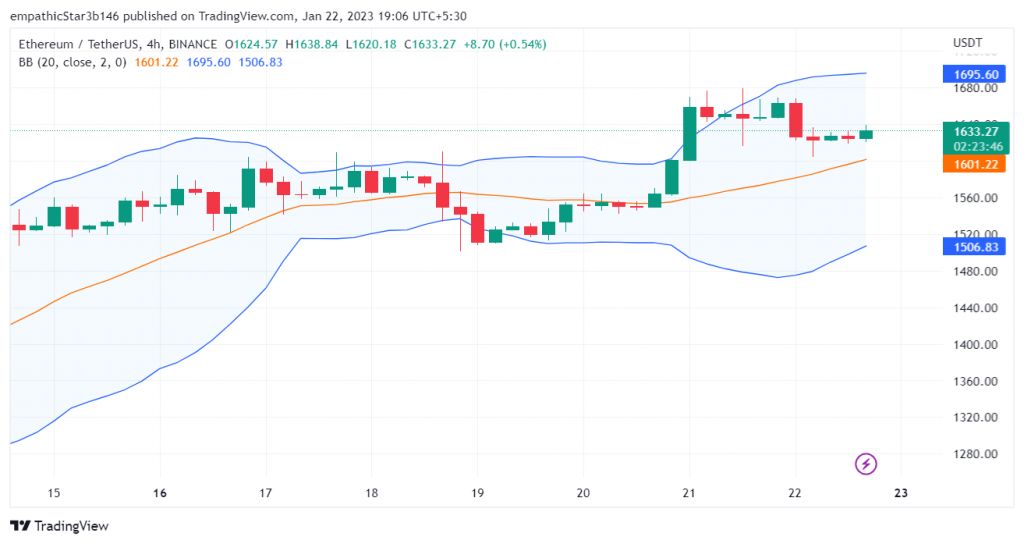
Bollinger Bands is an indicator that can be used to measure volatility in a fluctuating market. It consists of three lines: upper band, middle band, and lower band. The middle band is the 20-day simple moving average of closing prices, and the upper and lower bands are 2 standard deviations from this moving average. When prices move closer to or move away from the upper band, it indicates that there is high volatility in the market. When prices move closer to or move away from the lower band, it indicates that there is low volatility in the market.
For example: Here’s a crypto chart, to which bollinger bands indicator has been applied to. Bollinger bands are popular indicators used by most traders. Its available on most charting platforms, and the lines on the chart will help you determine current market trends.
Parabolic SAR (PSAR)
Parabolic SAR (PSAR) is another momentum indicator that helps traders identify reversals by comparing current market activity against historical data points, such as recent highs/lows or volume spikes within specific periods (e..g., 5 minutes). Here’s how it works: First of all, PSAR uses standard deviation instead of standard deviation squared like MACD does, which means more weighting towards recent events rather than old ones when calculating signals; secondly, PSAR applies some formulae before generating signals which helps reduce false positives while retaining enough accuracy; thirdly unlike MACD which only looks at two periods, PSAR also takes into account previous weeks’ prices too.
This means that PSAR can be used to identify reversals in the market while also giving traders an indication of where they might want to enter or exit trades based on their own personal risk tolerance levels.
Relative Strength Index (RSI)
RSI is a well-known momentum indicator that uses an index of numbers between 0-100 to help traders identify overbought/oversold conditions within the market. The theory behind RSI is that when prices are rising or falling strongly without any significant pullbacks, then it’s likely that a reversal will occur soon.
However, this is not always the case, and sometimes traders will use RSI in conjunction with other indicators, such as MACD or PSAR, to confirm their trade entries.
Risk and Reward Considerations for Swing Trading
When swing trading, it is important to consider the risk and rewards of each trade. It is important to understand that there is always the potential for losses, even if the markets are bullish.
It is also important to understand the potential rewards of a trade. For example, if a trader is able to identify a good trading opportunity and enter and exit at the right time, they could make a large profit.
When assessing the risk and reward of a trade, it is important to consider the size of the trade, the expected return, and the amount of capital at risk. By understanding the potential risks and rewards of a trade, traders can make informed decisions about when to enter and exit positions.
Tips for Successful Swing Trading
Swing trading can be a lucrative strategy, but it is important to understand the risks involved. Here are some tips for successful swing trading:
Before entering a trade, it is important to have a plan in place. This plan should include the entry and exit points, the amount of capital at risk, and the expected return. Having a plan in place will help traders make informed decisions.
It is important to stay up to date on the latest news about Bitcoin. Market-moving news events can create trading opportunities, so it is important to keep an eye on the news.
It is important to take a disciplined approach to trade. Traders should not enter and exit positions too often, as this can increase their risk. Instead, they should focus on entering and exiting at the right times.
Stop-loss and take-profit orders are important tools for managing risk and maximizing profits. Setting these orders before entering a trade will help traders limit their losses and maximize their profits.
Key Takeaways
Swing trading is a trading strategy that involves holding an investment for a relatively short period of time, usually ranging from one day to three weeks.
Swing traders attempt to capture gains in the stock market by identifying short-term trends and taking advantage of them.
Conclusion
As you’ve learned, swing trading is a strategy that can be used in any market. It allows you to capitalize on short-term price fluctuations.
We hope that after reading this guide, you are more aware of how to start your own Bitcoin swing trading strategy and that it gives some insight into what makes successful traders tick.
WeInvests is a financial portal-based research agency. We do our utmost best to offer reliable and unbiased information about crypto, finance, trading and stocks. However, we do not offer financial advice and users should always carry out their own research.
Read More