Technical analysis plays a vital role in trading decisions, and the Ichimoku Cloud Indicator is a popular tool in this field. It provides a comprehensive view of price trends, support and resistance levels, and potential trading signals.
Developed by Goichi Hosoda, the Ichimoku Cloud Indicator combines multiple components, including the Tenkan-sen, Kijun-sen, Senkou Span A and B, and Chikou Span.
Traders use this indicator to identify trend direction, assess momentum, and determine entry and exit points. With its historical background and widespread usage, the Ichimoku Cloud Indicator continues to be a valuable tool for technical analysis in the financial markets.
The components of the Ichimoku Cloud Indicator
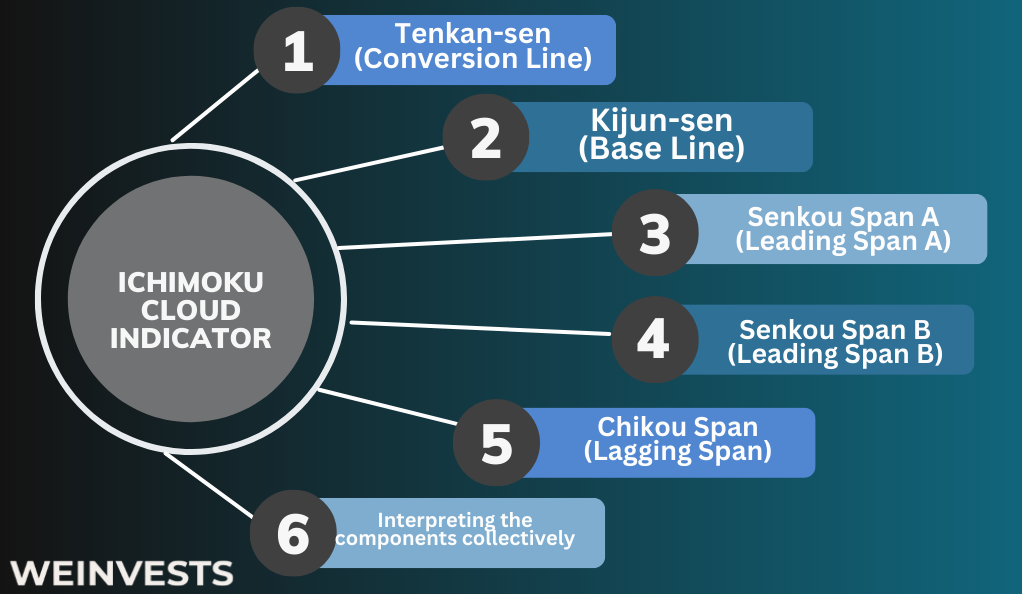
The Ichimoku Cloud Indicator consists of several components used in technical analysis. Here is a list with brief descriptions of each component:
- Tenkan-sen (Conversion Line): This line calculates the average of the highest high and lowest low over a specific period, typically nine periods. It provides insights into short-term price momentum.
- Kijun-sen (Base Line): Similar to the Tenkan-sen, the Kijun-sen calculates the average of the highest high and lowest low, but over a longer period, typically 26 periods. It helps identify medium-term price momentum.
- Senkou Span A (Leading Span A): This component represents the average of the Tenkan-sen and Kijun-sen, plotted ahead of the current price action. It forms one edge of the Ichimoku Cloud and acts as a support or resistance level.
- Senkou Span B (Leading Span B): This component calculates the average of the highest high and lowest low over a more extended period, typically 52 periods. It forms the other edge of the Ichimoku Cloud and provides additional support or resistance levels.
- Chikou Span (Lagging Span): The Chikou Span plots the current closing price but shifted back by a specific number of periods. It helps traders identify potential trend reversals or confirmations by comparing the current price to past price action.
- Interpreting the components collectively: Traders analyze the relationships among these components, the position of the price in relation to the Cloud, and crossovers between the lines to generate trading signals and make informed decisions.
Applying the Ichimoku Cloud Indicator in trading strategies
The Ichimoku Cloud Indicator can be applied in trading strategies to gain valuable insights and make informed decisions. Traders can utilize the indicator in various ways:
Firstly, it helps identify the direction of the trend by observing whether the price is above or below the Cloud. A price above the Cloud suggests an uptrend, while a price below the Cloud indicates a downtrend.
Secondly, the indicator assists in determining support and resistance levels through the Senkou Span A and Senkou Span B components. These levels can help traders identify potential areas of price reversal or significant barriers.
Moreover, the Ichimoku Cloud Indicator generates entry and exit signals. For example, a bullish signal occurs when the Tenkan-sen crosses above the Kijun-sen, and the price is above the Cloud. Conversely, a bearish signal occurs when the Tenkan-sen crosses below the Kijun-sen, and the price is below the Cloud. These signals aid in identifying optimal entry and exit points.
Traders often combine the Ichimoku Cloud Indicator with other technical indicators, such as oscillators or moving averages, to enhance their trading strategies. This integration can provide further confirmation or identify potential trend reversals.
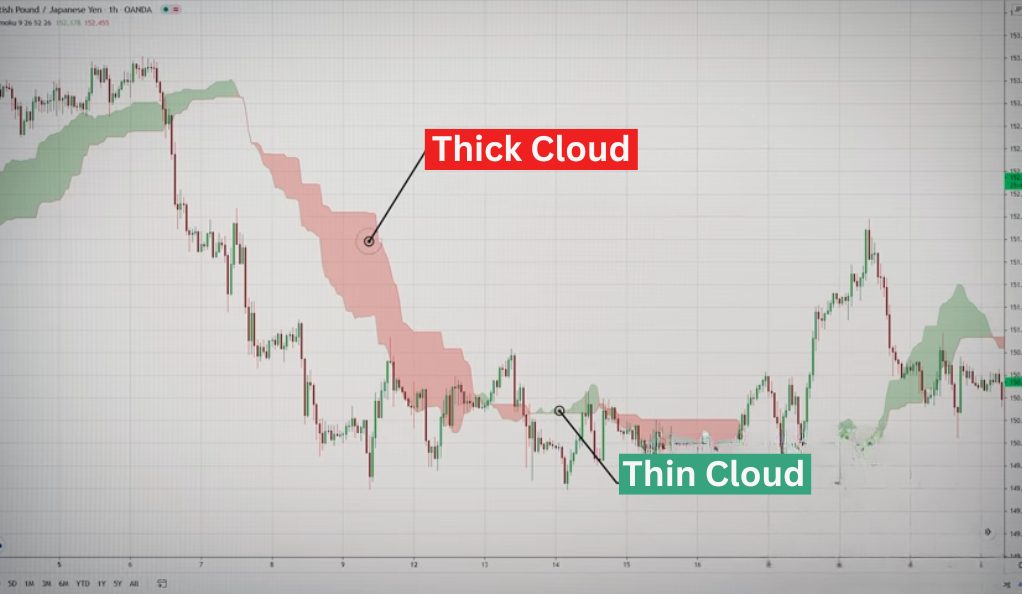
Analyzing the cloud’s color and thickness
Analyzing the color and thickness of the Ichimoku Cloud provides additional insights for traders. Here’s how:
| Step | Description |
| 1. Understanding the cloud’s color-coded significance | – Green Cloud: Bullish trend |
| – Red Cloud: Bearish trend | |
| 2. Evaluating the thickness of the cloud | – Thick Cloud: Strong support/resistance levels |
| – Thin Cloud: Weaker support/resistance levels | |
| 3. Practical applications of color and thickness analysis | – Consider color and thickness alongside other Ichimoku Cloud components |
| – Confirm upward trend: Bullish signal + thick green Cloud | |
| – Confirm downward trend: Bearish signal + thick red Cloud |
By considering the color and thickness of the Cloud, traders can gain additional insights into market trends, confirm signals generated by other components, and make more informed trading decisions.
Advanced trading techniques with the Ichimoku Cloud Indicator
The Ichimoku Cloud Indicator provides advanced trading techniques for gaining insights, including the Chikou Span confirmation, breakout strategies, multi-timeframe analysis, and combining them with other methodologies. These techniques enhance trading strategies and improve decision-making.
- Utilizing the Chikou Span as a confirmation tool:
- Traders can use the Chikou Span to confirm signals generated by other components of the Ichimoku Cloud Indicator.
- When the Chikou Span crosses above the price, it can confirm a bullish signal, while a cross below the price can confirm a bearish signal.
- Trading with the Ichimoku “Kumo” breakout strategy:
- Traders look for breakouts above or below the Cloud (Kumo) as potential entry points.
- A bullish breakout occurs when the price breaks above the upper Cloud boundary, while a bearish breakout happens when the price breaks below the lower Cloud boundary.
- Applying the Ichimoku Cloud Indicator to multiple timeframes:
- Traders can analyze multiple timeframes (e.g., daily, weekly, monthly) to gain a broader perspective of the market.
- Consistency in trend direction and supportive signals across different timeframes can increase the probability of successful trades.
- Combining the indicator with other trading methodologies:
- Traders often combine the Ichimoku Cloud Indicator with other technical indicators, such as oscillators or moving averages, to strengthen their trading strategies.
- This integration can provide additional confirmation or help identify potential trend reversals.
It’s important to note that these advanced techniques require practice, experience, and a thorough understanding of the Ichimoku Cloud Indicator. Traders should also consider risk management and other fundamental factors when implementing these strategies.
Backtesting and gaining familiarity with the indicator’s behavior under different market conditions can further enhance trading proficiency.
Backtesting and Optimizing the Ichimoku Cloud Indicator
Backtesting and optimizing the performance of the Ichimoku Cloud Indicator are vital steps in evaluating its effectiveness and fine-tuning it for optimal trading outcomes. Here’s a breakdown of the process:
- Step 1: To begin, gather historical data on the relevant asset or market for backtesting purposes. This data can be obtained from financial data providers or trading platforms.
- Step 2: Next, set up the parameters for backtesting. Define the time period and frequency of the backtest, along with the specific periods for the Tenkan-sen, Kijun-sen, Senkou Span A and B, and Chikou Span components.
- Step 3: Execute the backtest using the historical data and analyze the results. Interpret the generated trading signals, evaluate the accuracy of the signals, and assess the profitability of trades to gauge the performance of the Ichimoku Cloud Indicator.
- Step 4: Based on the backtesting results, make necessary adjustments to the indicator’s parameters. Fine-tune the settings by modifying the period lengths or exploring different timeframes to improve their performance.
Remember that backtesting provides insights into past performance and should be used as a tool for evaluating the indicator’s strengths and weaknesses. It is important to note that past performance does not guarantee future results.
By iteratively backtesting and optimizing the Ichimoku Cloud Indicator, traders can strive to enhance its effectiveness and align it with their trading strategies.
Real-world Examples of Ichimoku Cloud Indicator Application
Real-world examples showcase the practical application of the Ichimoku Cloud Indicator across different trading scenarios. Here are three case studies highlighting its versatility:
Case Study 1: Trend Identification and Confirmation
Traders use the Ichimoku Cloud Indicator to identify and confirm trends. For example, during an uptrend, if the price remains consistently above the Cloud, with Tenkan-sen crossing above Kijun-sen, it confirms the bullish trend.
Case Study 2: Support and resistance analysis
The Ichimoku Cloud Indicator helps analyze support and resistance levels. If the price consistently finds support at the Cloud’s lower boundary (Senkou Span B) and encounters resistance near the upper boundary (Senkou Span A), it strengthens the reliability of these levels for traders.
Case Study 3: Generating Entry and Exit Signals
Traders utilize the Ichimoku Cloud Indicator to generate entry and exit signals. For instance, when the price breaks above the Cloud (Kumo) after a period of consolidation, it may indicate a bullish breakout and serve as a potential entry signal. Conversely, a break below the Cloud might signal a bearish breakout and an exit opportunity.
These case studies demonstrate the practical applications of the Ichimoku Cloud Indicator in various market situations. Traders can leverage its components, such as trend identification, support and resistance analysis, and signal generation, to make well-informed trading decisions and enhance their strategies.
Ichimoku Cloud Indicator for different trading instruments
The Ichimoku Cloud Indicator is versatile and can be applied to various trading instruments. Here’s a breakdown of its application across different markets:
- Stocks and equity markets: Traders can utilize the Ichimoku Cloud Indicator to analyze trends, identify support and resistance levels, and generate entry and exit signals for individual stocks or broader equity market indices.
- Forex and currency trading: The indicator is widely used in forex trading to assess currency pairs’ trends, determine key levels of support and resistance, and aid in timing trades based on the generated signals.
- Cryptocurrencies and digital assets: The Ichimoku Cloud Indicator can be applied to analyze trends, identify potential breakouts or reversals, and assist in timing entry and exit points for cryptocurrencies and digital assets.
- Commodities and futures markets: Traders in the commodities and futures markets can employ the Ichimoku Cloud Indicator to identify trends, assess key levels of support and resistance, and generate signals for commodity futures contracts.
Advantages and limitations of the Ichimoku Cloud Indicator
| Advantages | Limitations/Challenges |
| Provides a comprehensive view of market trends and dynamics | The complexity and learning curve may be daunting for beginners |
| Offers clear visual signals for trend identification and confirmation | False signals can occur during periods of market consolidation |
| Incorporates multiple components for robust analysis | Interpretation can be subjective, leading to varying outcomes |
| Helps identify support and resistance levels | The lagging nature of some components may result in delayed signals |
| Suitable for various trading instruments and timeframes | Requires historical data and backtesting for optimization |
It’s important to note that the advantages and limitations listed above are general observations and may vary depending on the trader’s experience, market conditions, and individual trading strategies.
Summary
The Ichimoku Cloud Indicator is a versatile tool that provides traders with a comprehensive view of market trends and dynamics. It offers advantages such as clear visual signals, support/resistance identification, and suitability for various instruments and timeframes.
However, there are challenges including complexity, false signals during consolidation, and subjective interpretation. Traders can overcome limitations by gaining experience, optimizing the indicator through backtesting, and combining it with other analysis techniques.
By leveraging its strengths and managing its limitations, traders can utilize the Ichimoku Cloud Indicator to enhance their trading strategies and make well-informed decisions in the financial markets.
FAQ
What is the Ichimoku Cloud Indicator?
The Ichimoku Cloud Indicator is a technical analysis tool used to identify trends, support, and resistance levels, and generate trading signals.
How does the Ichimoku Cloud Indicator work?
The indicator works by incorporating multiple components, such as the Cloud, Tenkan-sen, Kijun-sen, and Chikou Span. It analyzes their interactions to identify trend direction, support/resistance levels, and potential entry/exit points.
Can the Ichimoku Cloud Indicator be used for day trading?
Yes, the Ichimoku Cloud Indicator can be used for day trading. Traders can adjust the indicator’s parameters to suit shorter timeframes and generate intraday trading signals.
Which timeframes are suitable for the indicator?
The indicator is suitable for various timeframes, including short-term, medium-term, and long-term. Traders can adapt the indicator to their preferred timeframe and trading strategy.
How accurate is the Ichimoku Cloud Indicator?
The accuracy of the Ichimoku Cloud Indicator depends on market conditions, proper interpretation, and understanding of its limitations.
How can the indicator be combined with other indicators?
Traders often combine the Ichimoku Cloud Indicator with other indicators, such as oscillators or moving averages, to validate signals or enhance trading strategies.
What are the penalties for non-compliance with cryptocurrency tax regulations?
Penalties for non-compliance vary and can include fines, interest, audits, and legal consequences.
WeInvests is a financial portal-based research agency. We do our utmost best to offer reliable and unbiased information about crypto, finance, trading and stocks. However, we do not offer financial advice and users should always carry out their own research.
Read More