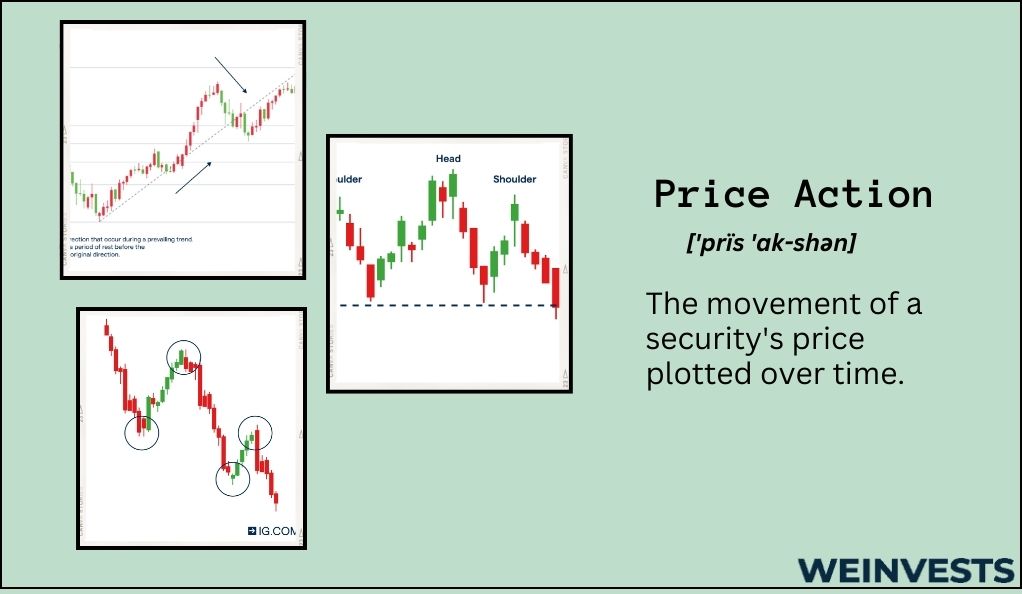
Technical trading is the art of using past price behavior to predict future price behavior. But not all forms of technical trading use past price information the same way.
Today, we’re discussing price action trading. On the surface, that might sound like another way of talking about technical trading in general. But price action trading is actually a specific form of technical trading.
Price action trading relies on incorporating an asset’s price movements to directly inform trading decisions. In other words, there’s no (or very little) transformation of prices into another form of indicator.
That means lagging indicators, indexes, and other types of technical strategies that rely on using prices as an input are excluded from price action strategies.
Here’s one way to think of it. If you’re baking a cake, you’ll need to use eggs to create the finished cake. But you could also just use the eggs by themselves to make a dish like scrambled eggs.
In this metaphor, eggs are like an asset’s past price information. They can be used as an ingredient of a recipe (like technical analysis in general) or left as the core part of a standalone dish (like price action specifically).
To further understand how prices can be used on their own to create profitable strategies, let’s evaluate why we might use price action versus more general strategies.
Table of Contents
Price Action vs. Technical Trading
A common thought when most traders encounter price action trading is to wonder why anyone would use it.
After all, how can it hurt to use prices not just on their own, but as an ingredient to calculate more complicated indicators?
To understand why price action might be a good choice for you, let’s review some of the best arguments in its favor.
Price action is simpler than other strategies
This is a huge bonus to using price action. If you don’t need to worry about leveraging complicated equations that include multiple different inputs to churn out a final answer, that will simplify your analysis a lot.
And we should remember that not all information is good information. After all, if someone came to your office while you were trying to trade to let you know the weather in a city across the country, would that help your trading?
Of course, it wouldn’t, because such information is not relevant to making trading decisions. That leads us to our next point.
Price information is the only information you need
This is a controversial argument that is made by price action adherents. Whether or not you agree with it depends on your views of fundamental analysis, technical analysis, and what drives asset performance.
But let’s suppose the argument is correct. Then price action might be a good choice since it naturally excludes any useless information.
Price action strategies are flexible
Another benefit to price action is that it is extraordinarily flexible.
Price is one piece of information that’s common to every market in the world; after all, markets can’t function without a price.
That means whether you’re trading stocks, bonds, forex, crypto, commodities, or something else, you can utilize price action strategies.
Of course, this argument ignores the fact that since liquidity and information differ between markets, not all price feeds are equally valuable. But in general, for a market with sufficient depth, this argument is plausible.
Key Concepts
While one benefit of price action is its simplicity, that doesn’t mean there’s not a bit of a learning curve associated with its use.
But to accelerate your learning, we’ll list some of the key concepts that you need to be aware of to use price action strategies. Remember, each of these concepts could warrant an entire article itself, so be sure to do extra research on these topics to fully understand them.
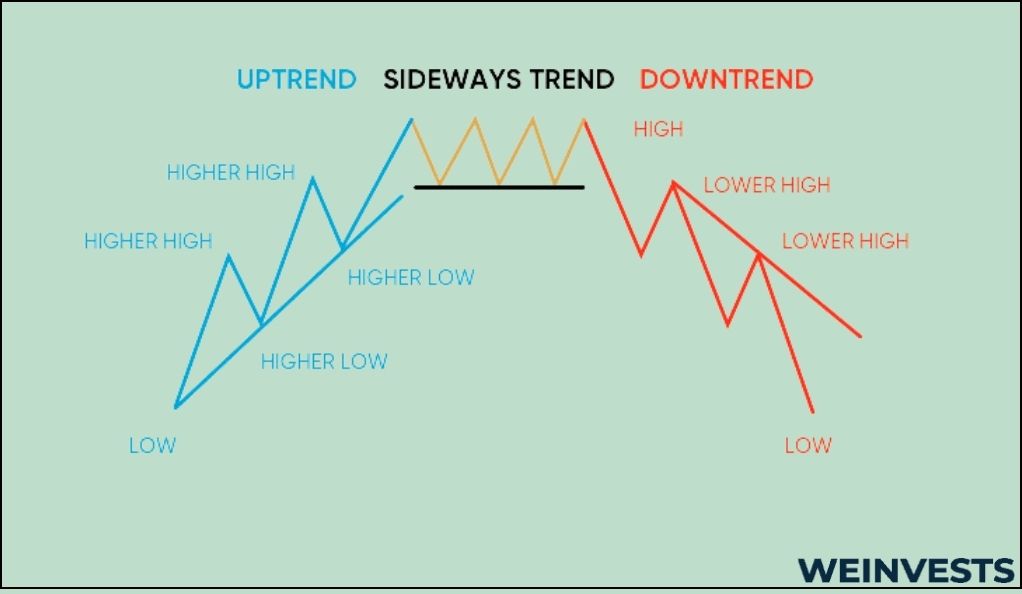
Trends
Understanding asset trends are key to using price action strategies effectively.
A trend occurs when an asset’s price will continue moving in the direction it’s moving. For instance, if a stock is increasing, then it could be in an uptrend. Meanwhile, a falling price could indicate a downtrend.
Of course, if an asset is “trading sideways,” and merely bouncing around, that could indicate no trend at all.
Identifying trends when they exist and avoiding false trends is critical in price action strategies.
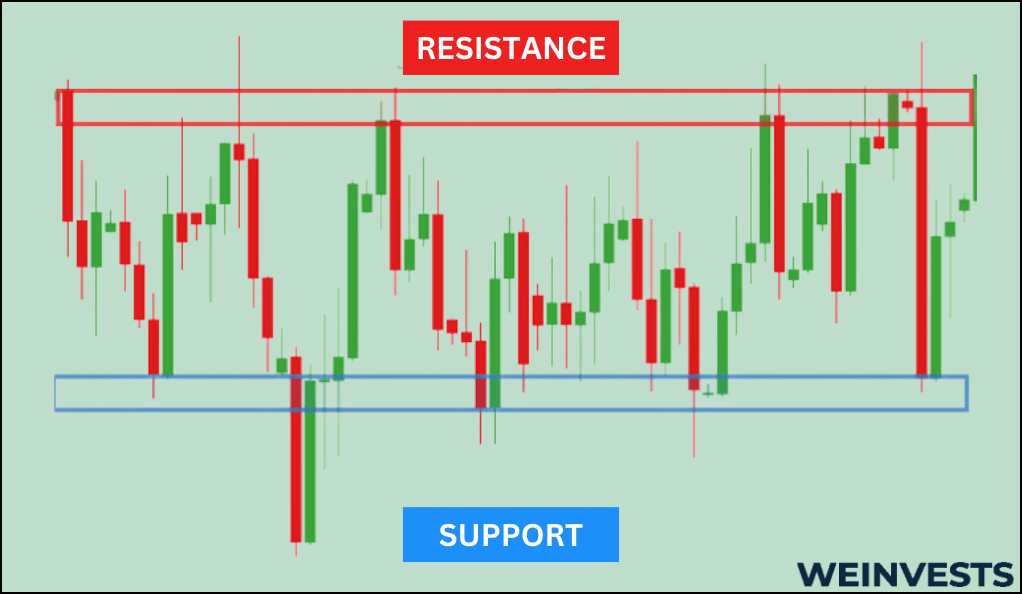
Support and resistance levels
Support and resistance levels for an asset indicate price points at which a stock is unlikely to pass through.
Support, as the name implies, occurs when an asset is unlikely to fall below a certain price.
Resistance, meanwhile, means a stock struggles to climb above a certain price.
These levels can be fixed or moving. For instance, a support level can be marked horizontally at $100, or diagonally at a certain rate of increase from $100.
When a stock “breaks through” support and resistance levels decisively, that usually indicates that a trend is over. In some cases, the trend could be about to reverse.
Peaks and troughs
Peaks and troughs can also be known more simply as highs and lows.
This might appear to be a basic concept that can be easily visually identified on a price chart. And, for the most part, that’s true.
But there is some nuance to when a peak and trough have really occurred. The reason is that technical traders usually only deem highs and lows meaningful if they are “significant.”
Every trader will have a different definition of what significant means. But it usually means a clear, identifiable price movement that is not merely an artifact of its time scale (on short time scales, prices can be very jumpy, meaning there are many potential peaks and troughs).
Strategies and Techniques
Even though price action trading is more limited than outright technical trading, there are a number of different profitable trading strategies you can use.
Of course, profit isn’t guaranteed – you’ll need experience, expertise, and proper risk management.
With that being said, here are a couple trading strategies you can explore if price action trading seems like the right fit for you.
Trendline trading is closely aligned with the concept of trends we discussed earlier.
Trendline-based strategies rely on effectively drawing informative lines on a price chart to identify trends. For instance, you might draw an uptrend line by connecting a series of rising lows for an increasing asset.
Then, you can enter a trade based on that trend. For instance, if you think that a bullish trend has some strength to it, you can go long and exit the position when the trend starts to weaken.
Trendline trading also utilizes support and resistance levels to factor in when a trend could be fading.
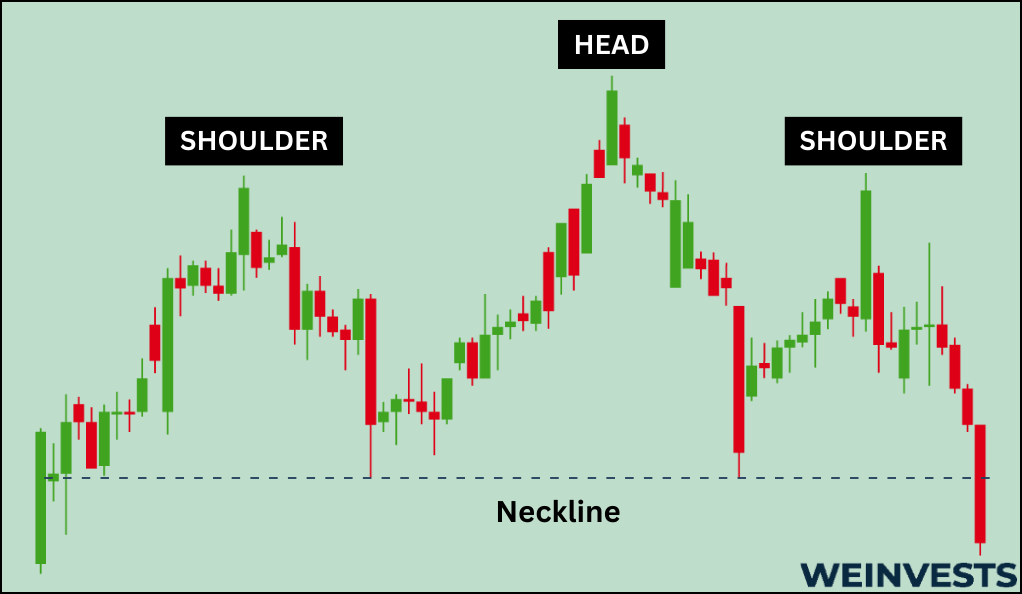
Some traders don’t just use lines to identify trends. Rather, they factor in multiple lines to form a “pattern.”
The range and meaning of these patterns are far too expansive to cover in this brief section. But the main idea is that specific price movements lead to a series of lines that are meaningful when interpreted altogether.
This can be a bullish or bearish interpretation, depending on the pattern. But once a pattern is identified, it can be used to make trading decisions, whether they be to enter or exit a position.
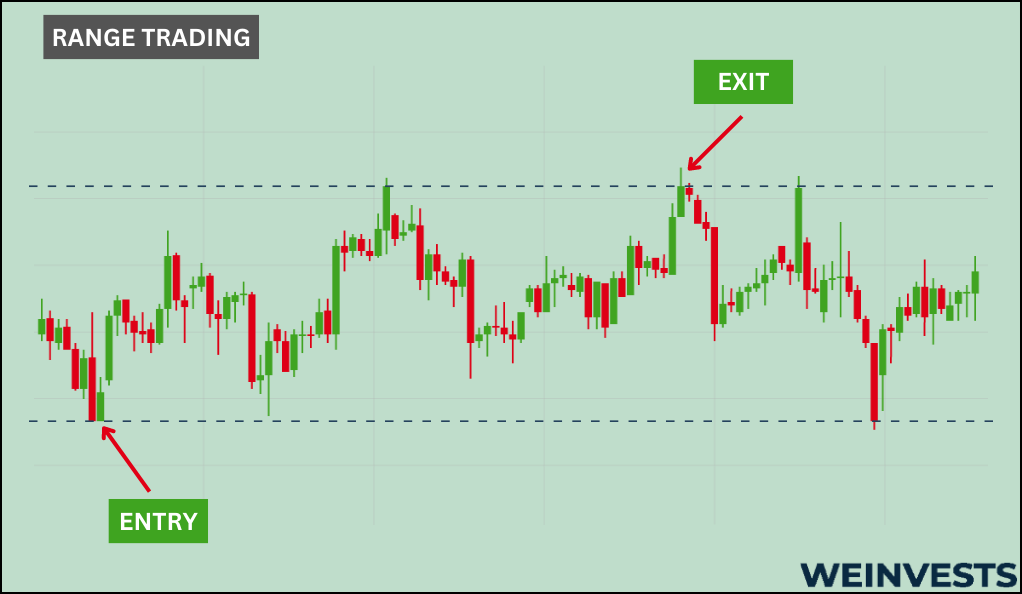
Range trading is kind of like the opposite of trendline trading.
Instead of an asset having a clear rising or falling trend, it may be merely trading within some predefined range. This is often the case in sideways markets, which may also tend to be more volatile than others.
Price action can be used to identify the top and bottom levels of a trading range for an asset. These are the range’s support and resistance levels.
There are several ways to profit from identifying a range, but one of the most common is to enter a position at the bottom of a range and exit it near the top.
Case Study
Now that’ve had a comprehensive overview of the basics of price action trading, let’s see how a real-life case study might play out.
- Identify an asset to trade based on its price chart. With the advent of automated software tools, traders have found it easier than ever to monitor multiple positions. Let’s say you’ve identified that the stock NKE is trading in a range of $100 to $110.
- Wait for a trading entry signal. Despite trading in this range, let’s say you’re not confident NKE will continue to bounce between $100 and $110. Instead, you wait for a breakout to occur. One day, NKE clears $110 and starts climbing higher. This breakout could be an entry signal.
- Confirm the trend. Of course, you don’t want to dive in without doing your homework. You can draw a trendline on the NKE chart to confirm that the trend really does exist.
- Enter the trade. Once you’re satisfied that an opportunity has really presented itself, you can execute the trade. Since this is a bullish uptrend, we can go long by buying the stock.
- Wait for an exit signal. Suppose we’ve been in the trade for a while and have been constantly updating our trendline which serves as our resistance level. One day, NKE starts retracing below the resistance level. After several violations of the trendline, we might believe that the trend is faltering.
- Exit the position. Wanting to play it safe and not risk our existing profits, we can exit the position by selling out of NKE.
This case study used several key price action concepts, including trendlines, resistance levels, breakouts, and ranges. While incorporating all these ideas into your strategies should help you make reliable profits, nothing is certain in the markets.
Let’s take a look at the risks that might trip us up when using price action strategies.
Potential Risks
As with any trading strategy, price action strategies come with certain risks.
Illiquid markets can lead to misleading info
With price action strategies, price is essentially the only information used. This can lead to an attractive simplicity, but it also means you must ensure the information you’re using is reliable.
Illiquid markets can have huge price swings based on small orders, simply because there are few market participants.
Therefore, to get the best results, it’s optimal to use price action strategies in markets with sufficient liquidity to ensure smooth price transitions between trend and range regimes.
Subjective patterns
This risk applies to using both price charts and trendlines. What can seem like a bullish uptrend to one person can scream bearish reversal to another.
Ultimately, it’s important to rely on yourself in trading. But beginners should also recognize that being able to properly identify certain price movements comes with time and experience.
False patterns
While some patterns are subjective, other patterns aren’t even patterns at all.
This occurs when an obvious ‘pattern’ swiftly collapses and fades away, with a trend reversing or a range disappearing.
Technicians still aren’t sure why such false patterns occur in the market. But being aware of their existence is important to ensure you cultivate a proper risk management framework.
Conclusion
Whether or not you choose to utilize price action strategies in your trading after this comprehensive guide is up to you.
But many traders will find that deeply focusing on this one area of technical trading is very useful before expanding to other technical strategies.
Partly, that’s because the concepts associated with price action strategies have been refitted to suit technical trading more generally. So, this could be a great introductory area for newer traders.
But any trading strategy is only good if it’s a good fit for the trader using it – so make sure you experiment and practice before committing to just one methodology.
FAQs
What is price action analysis?
Price action analysis, or price action trading, is when a trader uses unfiltered price information to make trading decisions. It is a subset of technical trading, which uses price action as one informative component.
Is price action trading profitable?
Many trading strategies, such as price action, can be profitable. But you’ll need to have the experience to make them work and a sound risk management framework to go along with it.
Is price action better than indicators?
There’s no one answer to whether price action is better than indicators. While indicators can be more complicated, they might also contain more information – but whether this is useful information depends on your unique trading strategy and style.
WeInvests is a financial portal-based research agency. We do our utmost best to offer reliable and unbiased information about crypto, finance, trading and stocks. However, we do not offer financial advice and users should always carry out their own research.
Read More