This content represents the writer’s opinions and research and is not intended to be taken as financial advice. The information presented is general in nature and may not meet the specific needs of any individual or entity. It is not intended to be relied upon as a professional or financial decision-making tool.
There are many different strategies out there that can be used to trade the market. Some of them are more effective than others, but all of them require you to do a lot of research beforehand.
Table of Contents
Basics Of Trading Strategies
A trading strategy is a set of rules or guidelines that a trader uses to make decisions when trading. These strategies are typically based on technical analysis, which looks at past market data to identify trends and patterns. Trading strategies can also be based on fundamental analysis, which looks at macroeconomic factors such as a company’s financial statements, market trends, and political events. Fundamental analysis can help traders determine the direction of the markets and identify potential opportunities.
No matter which strategy you choose, it’s important to have a solid understanding of the markets and the potential risks involved.
What is an Alligator Indicator?
An Alligator indicator is a technical analysis tool that helps traders identify potential entry and exit points in the markets. The indicator is based on the concept of the “alligator”, which is a combination of three moving averages. These moving averages are set at different periods, which helps identify trends and reversals in the markets.
The Alligator Indicator helps to determine the health of an asset’s price action. It’s made up of three lines, which are drawn on a price chart to show the strenght of an asset’s price action.The Alligator indicator is one of the most well-known and popularly used tool today. It was developed by Bill Williams in 1994.
The three lines that make up the Alligator indicator are:
- The red line represents an overbought condition. It rises above zero when prices rally too quickly.
- The yellow line represents an oversold condition. It falls below zero when prices fall too quickly.
- The blue line represents neutral conditions and is at zero when prices are neither overbought nor oversold; this means that they have reached a balance between buyers and sellers.
How Does It Work?
The Alligator uses the average of three previous candlesticks to determine when to buy and sell.
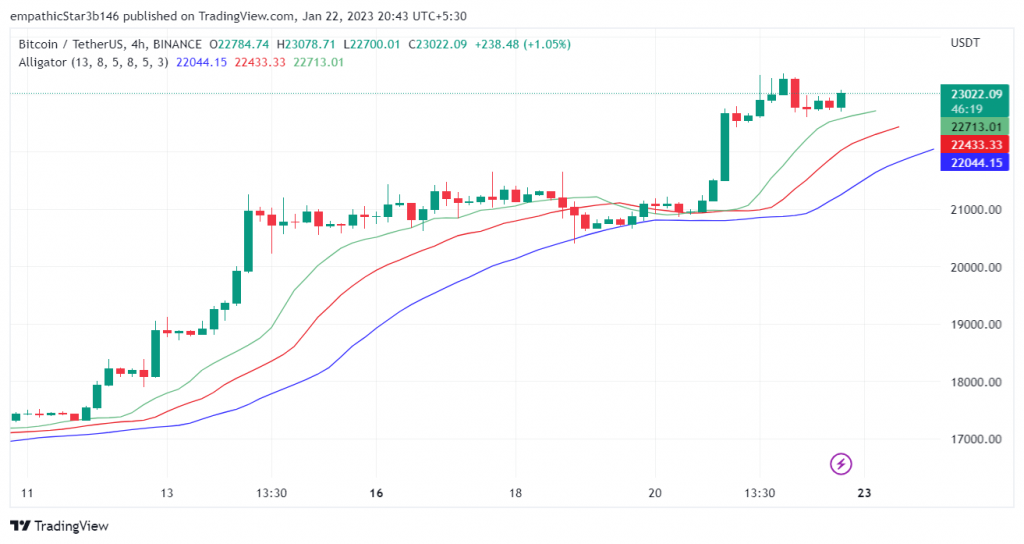
The Alligator’s upper jaw represents an overbought condition, while its teeth represents an oversold condition. When the two lines cross, it signals a buy signal because that means there is more buying pressure than selling pressure at that point in time (the green line crosses above the red line).
The lines are created using two moving averages: one with longer periods (50 days) and one with shorter periods (13 days). These moving averages act as support and resistance levels for price action on your chart.
What is the 200 EMA+MACD Indicator?
The 200 EMA+MACD indicator is a powerful tool that helps you to identify the direction of a market.The 200 EMA+MACD Indicator is an oscillator that uses two exponential moving averages to determine if a trend is bullish or bearish. The first average is set at a period of 200 days and the second average is set at 26 days, which gives us an indicator with two lines. One line will be above zero and one line will be below zero. If the long-term moving average crosses above the short-term moving average, then we have a bullish signal. If the long-term moving average crosses below the short-term moving average, then we have a bearish signal.
The MACD line is calculated by subtracting its signal from its original value. This results in two lines: one that rises above zero when prices fall and one that falls below zero when prices rise (see chart below). The MACD triggers sell signals when it crosses below its signal line and buy signals when it crosses above its signal line.
How Does It Work?
The 200 EMA+MACD indicator is a combination of two technical indicators: the exponential moving average (EMA) and the MACD. It’s a useful tool for traders who want to use technical analysis to predict future price movements, and it can help you find entry and exit points for trades.
For Example; Here is a BTC chart, which the 200EMA + MACD indicator has been applied.
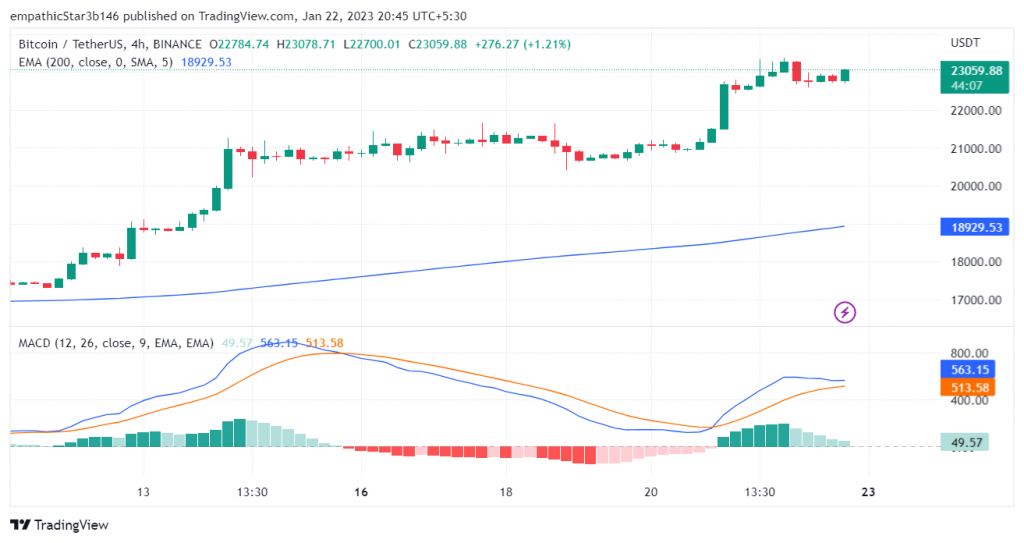
The EMA helps smooth out price fluctuations so that you don’t get caught up in short-term movements that may not actually be relevant to long-term trends. It also makes it easier to spot trends, because once prices cross above or below an EMA line, they tend not to stray far from those levels again until another change occurs in market sentiments.
The MACD measures momentum by subtracting values from each other over periods of time; its signals indicate when momentum is strong enough for traders who want more information before committing capital. A positive difference between two EMAs means demand is stronger than supply; conversely, negative differences mean supply exceeds demand by some amount–and this relationship determines whether markets are trending up or down overall.
What is the RSI Indicator?
The Relative Strength Index (RSI) is a momentum indicator that measures the magnitude of recent price changes to determine overbought and oversold conditions of a security. The RSI oscillates between 0 and 100. Traditionally, and by default, the RSI is plotted with an upper boundary of 70 and a lower boundary of 30. This means that if the RSI is between 30 and 70, the security is seen as being neither oversold nor overbought; once it crosses above 70 or below 30, it becomes overbought or oversold, respectively.
The RSI was developed by J. Welles Wilder in 1978 and introduced in his book “New Concepts in Technical Trading Systems”. The Relative Strength Index is a broad measure of momentum that has proved useful for identifying intermediate-term market turning points.
How Does It Work?
The RSI can be used as an overbought or oversold indicator, but it should not be used as an absolute buy or sell signal because there are many other factors involved in making money in the stock market.
Here’s an example of how we can use RSI:
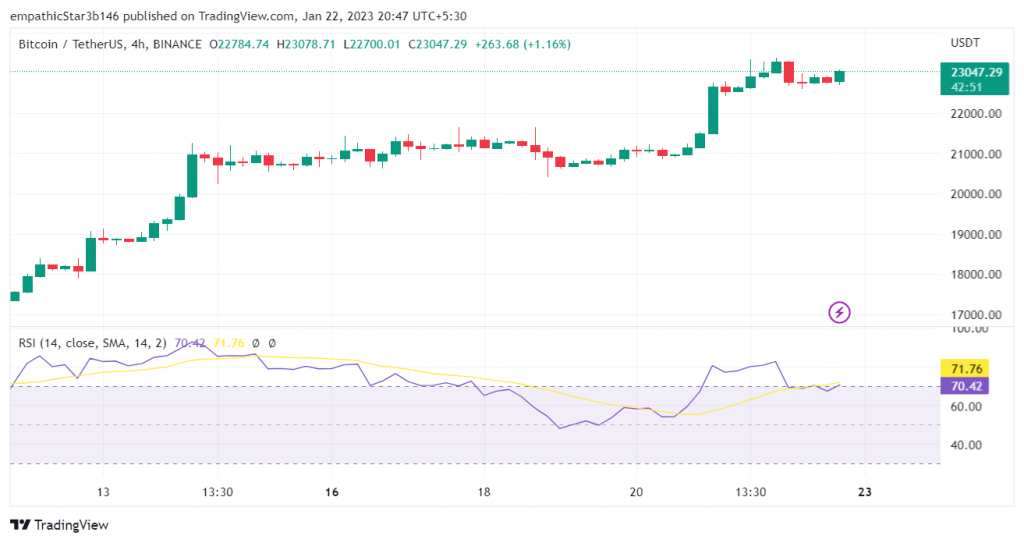
We want to know if Bitcoin is overbought or oversold. We use the 14-day RSI as it will give us a good idea if Bitcoin is trending up or down. If we look at our chart below, we can see that Bitcoin’s 14-day RSI reached new highs last week when it hit 71.76 before falling back down to 70. This means that Bitcoin was very overbought and it was due for some profit taking.
The RSI is most commonly used as a momentum indicator and can be applied to any time frame, but it’s most effective on a weekly or monthly basis. It also works well in conjunction with other technical indicators such as stochastic oscillators, moving averages and moving average convergence-divergence (MACD)
What is the MACD Divergence?
The MACD divergence is a technical analysis tool that combines two moving averages. It is typically used to identify potential long and short positions in the markets. The MACD line is calculated by subtracting its 26-day exponential smoothing (EMA) from its 12-day EMA; this gives you an indication of whether prices are rising or falling over a shorter time period than just looking at closing prices each day.
How Does It Work?
The MACD also helps you identify trend changes and avoid market reversals. The MACD uses three lines: the signal line, moving average (EMA) lines, and a histogram that shows the difference between these values. When the histogram crosses above or below zero, it indicates that the trend is likely changing direction; this information gives traders an opportunity to exit their positions before prices reverse again.
A bullish divergence occurs when the histogram rises above zero, while a bearish divergence occurs when it falls below zero. Both divergences indicate that prices are likely to reverse direction and may be an early sign of trend reversal. If your MACD line crosses below its signal line, then it indicates that there was no upward trend change during that period. You should wait until another crossover appears before trading against it.
When used in conjunction with other technical indicators, the MACD Divergence can provide valuable insight into future price movements.
What is the ATR Indicator?
The average true range (ATR) is a technical analysis tool that measures the volatility of a security over a given period of time. The ATR is calculated by taking the average of the high, low, and closing prices over a given period. The ATR is a powerful tool for traders, as it can help them identify potential entry and exit points in the markets. Traders can use this indicator to identify potential opportunities in the markets, as well as determine the best times to enter and exit trades.
How Does It Work?
The ATR indicator is a measure of volatility that’s used in technical analysis. It’s calculated by taking the average of the true range over a given period, which can be either one day or several months. The ATR represents how far an asset moves up or down on average per day (or month).
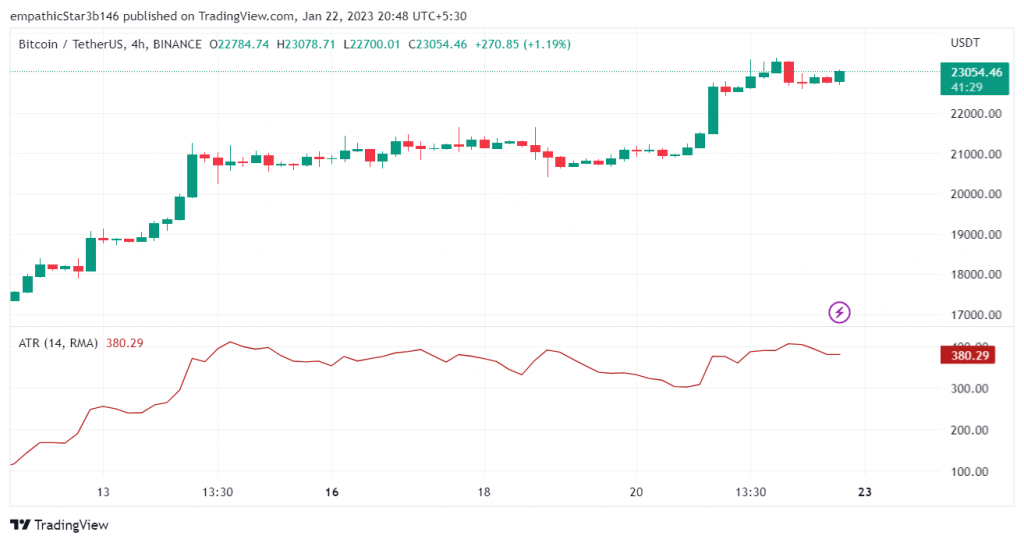
The higher your ATR value is, the more volatile your investment is expected to be; conversely, if you have a low ATR value, then this means that your investment has little price movement over time and may not be suitable for short-term traders who expect quick profits from their trades.
The ATR is a simple yet effective tool for identifying a potential trend, as well as showing how volatile an investment is. It’s also a good way to measure your risk tolerance when trading on margin or using options contracts because it allows you to compare your portfolio’s volatility with that of other investments in the market.
How To Use These Strategies?
Once you’ve identified a trading strategy that works for you, you’ll need to decide how to apply it. This will depend on your own personal trading style and risk appetite.
It’s also important to remember that no trading strategy is 100% foolproof and that past performance is not indicative of future results. It’s essential to understand the risks involved and have a solid understanding of the markets before you start trading.
Once you’ve identified potential long or short positions, you’ll need to decide when to enter and exit trades. This will depend on your own risk appetite and trading style.
Key Takeaways
- The 200 EMA+MACD Indicator is useful for identifying potential reversal points.
- The RSI Indicator is useful for identifying overbought and oversold conditions in a security.
- The MACD Divergence is a useful tool for identifying potential reversal points.
- Finally, the ATR Indicator is useful for measuring the volatility of a security.
Final Notes
Using effective trading strategies is essential for any investor or trader who wants to maximize their profits in the financial markets.
WeInvests is a financial portal-based research agency. We do our utmost best to offer reliable and unbiased information about crypto, finance, trading and stocks. However, we do not offer financial advice and users should always carry out their own research.
Read More