If you’re a technical trader, you know how important indicators are.
And while the vast majority of indicators are focused on price direction, some key indicators go beyond this to explore other measures of an asset’s recent performance.
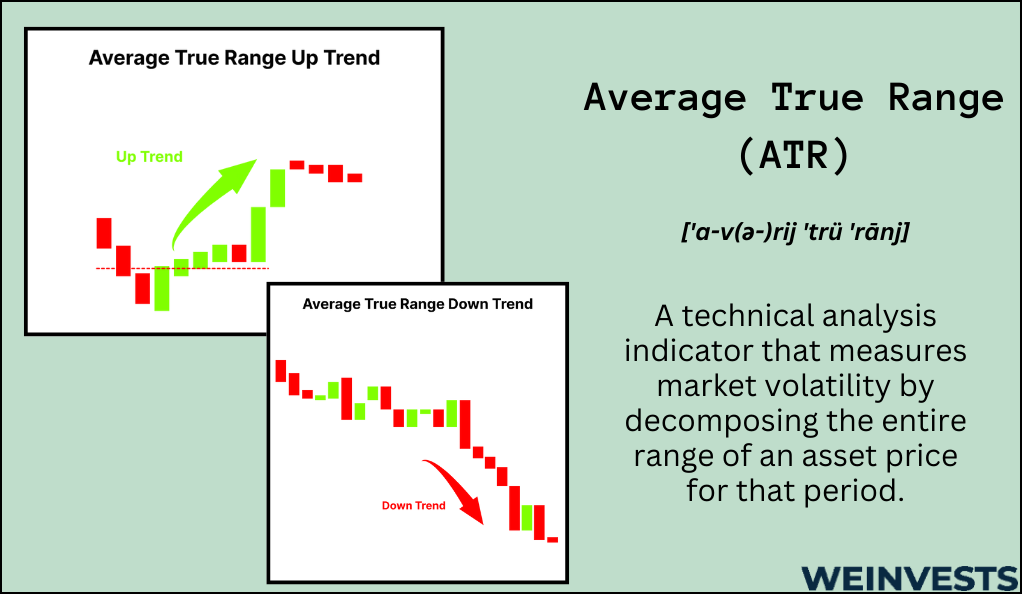
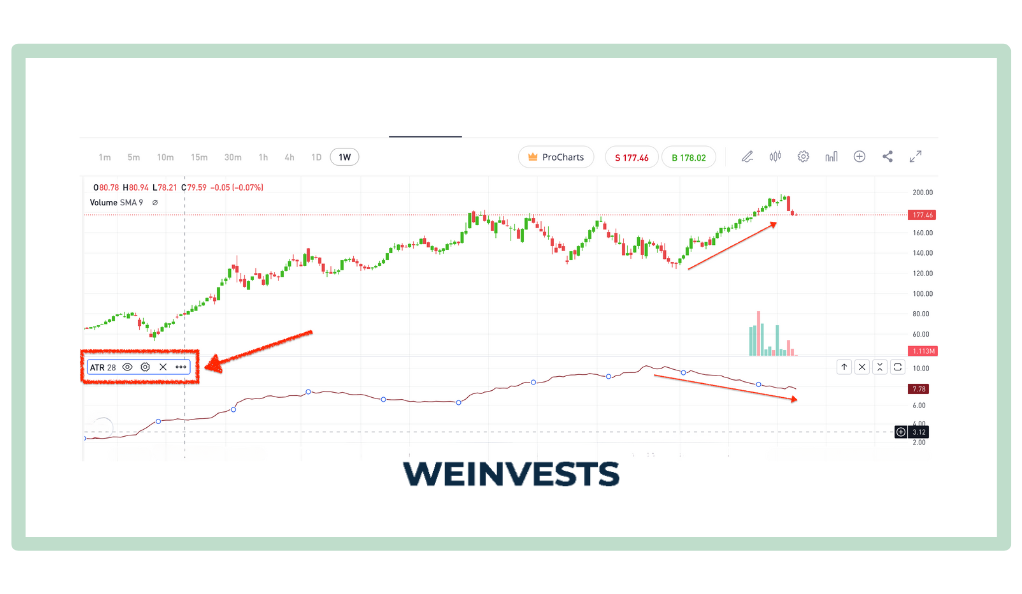
Today, we’re talking about one such indicator: the Average True Range (ATR).
The ATR is used to capture information related to an asset’s volatility. By using the ATR in conjunction with direction-based indicators, technical traders can develop a robust trading strategy that is more expansive than what basic techniques can allow.
Before we can fully understand how this indicator works, we’ll need to walk through a couple
key concepts that may be unfamiliar to some technical traders.
Key Concepts
Most indicators are used to tell traders if an asset is likely to rise or fall. Think of indicators like the Moving Average Convergence Divergence (MACD) or the Relative Strength Index (RSI).
Unlike these indicators, the ATR isn’t about price direction. Instead, it’s concerned with volatility.
The importance of volatility
If you’re not familiar with the term, volatility is essentially a measure of how much an asset’s price bounces around.
Volatility is important supplemental information about an asset because price direction, measured by an asset’s average recent returns, doesn’t tell the whole story.
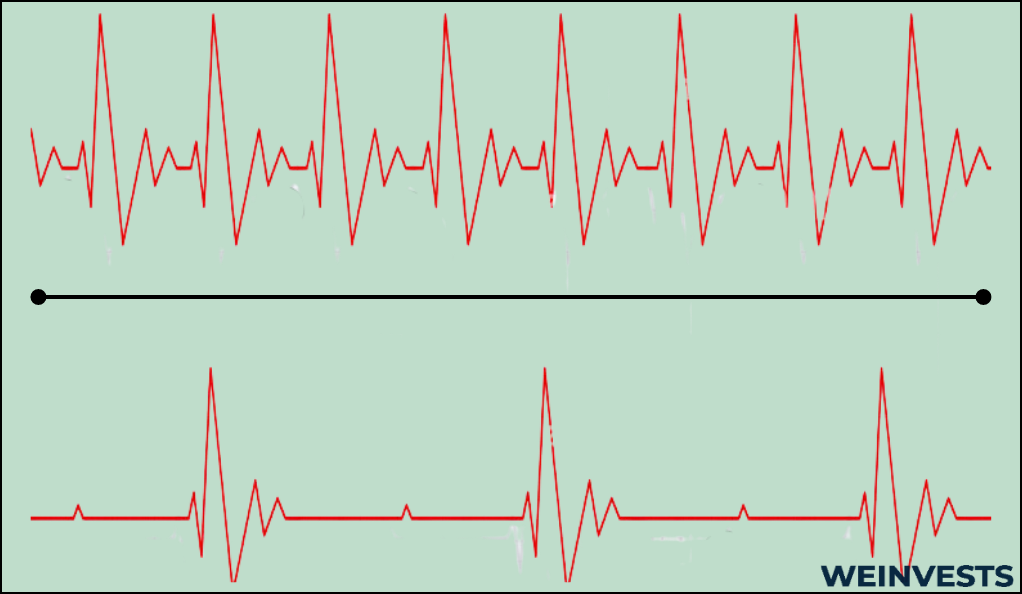
To understand why average returns might be insufficient to fully understand an asset’s performance, think about the heart rate monitors that you see in the hospital.
Let’s say two patients each have an average heartbeat of 80 beats per minute. Patient one’s heartbeat, however, varies between periods of rapid beating and periods of slower beating. Patient two, meanwhile, has a steady beat throughout the day.
If a doctor only saw the 80 beats per minute average, it wouldn’t tell the whole story about the health of each patient. They’d need to know that patient one had a more volatile heartbeat than patient two.
The same idea applies to asset prices. Two assets can have similar average return performance, as measured by their price changes. But the volatility of these changes matters too.
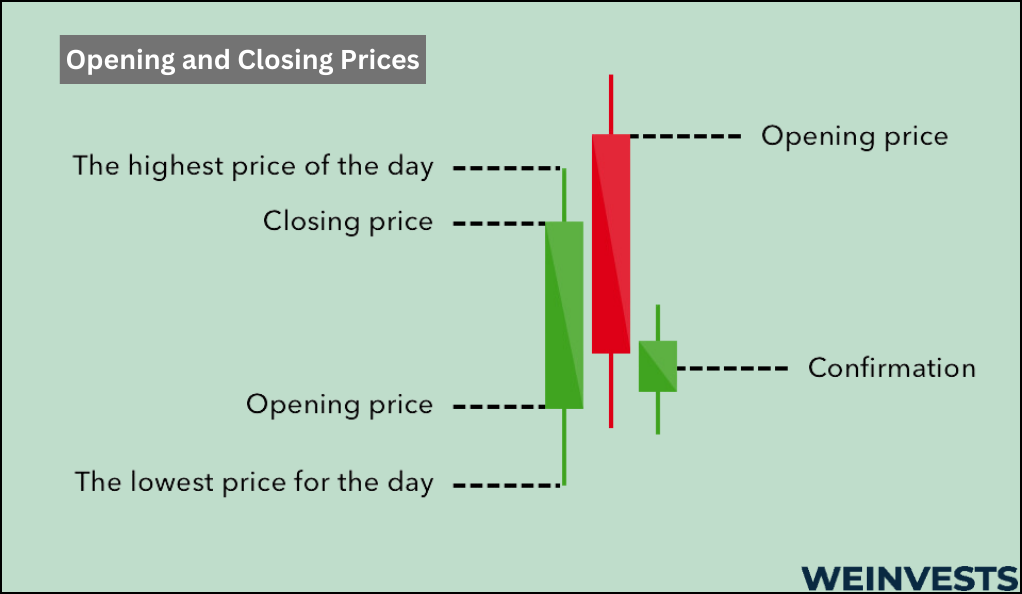
Opening and Closing Prices
Many asset markets (most notably the stock market) do not run 24/7. That means the market will close for the day and reopen the next day.
The closing price is the price of the final trade registered on the exchange that day. The opening price, meanwhile, is the price of the first trade registered on the exchange the next day.
Due to the time gap, the opening and closing prices are rarely the same price. This is an important fact to keep in mind because the two prices are often presented in price data as if they occurred back-to-back.
Range and true range
Ranges are key to some other trading strategies, such as range trading, so technical traders are wise to familiarize themselves with this concept regardless of whether they’ll use the ATR or not.
Essentially, a range is the difference between an asset’s high and low points during a certain time period. Let’s say a stock traded between $200 and $220 in a day. Then the stock’s range for the day is $20.
The ATR takes the concept of range a step further by introducing true range.
The need for the true range to be used comes from two separate facts about most asset markets.
- News often occurs overnight, which moves asset prices.
- Today’s opening price is different from the previous day’s closing price.
So, imagine if an asset’s opening price was significantly higher than the previous day’s closing price. That’s a big, volatile spike. But if we were only calculating intraday volatility, we would completely miss out on this.
The true range makes up for that fact by considering volatility not just within a given day, but also compared with the previous day.
To see a full explanation of how true range works, let’s take a deep dive into the mechanics behind the ATR indicator.
ATR Explanation
Now that we’ve covered the concepts that underlie the ATR, we can explain the actual equation itself.
To measure the ATR, you’ll first need to calculate three figures in order to find the true range.
- three equations showcasing the three separate calculations
- Absolute value of the asset’s highest price minus the previous day’s closing price.
- Absolute value of the asset’s lowest price minus the previous day’s closing price.
All “absolute value” means is that if there’s a negative sign, we remove it.
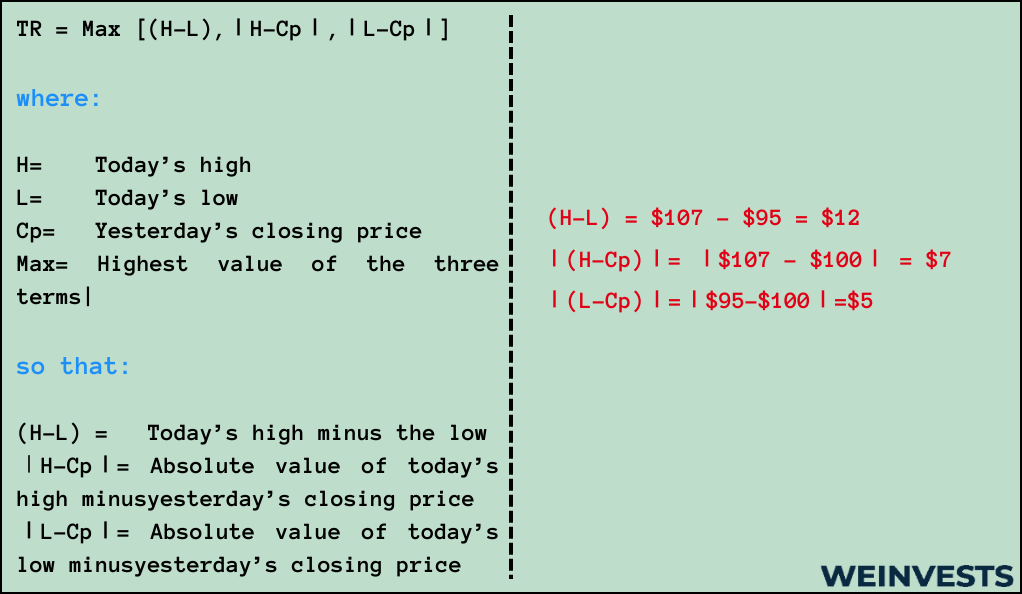
So, let’s say we have a stock that closed the previous day at $100. Today, it hit a high of $107, and a low of $95. Then figure one is 12, figure two is 7, and figure three is 5.
Then, to find the true range, just pick the highest of the three figures. In our example, we have the simple case of when the true range of an asset is just the intraday range, but with a few adjustments we could have a case in which the previous closing price was factored in.
Of course, now that we have the “true range” component of the average true range, we also need to factor in the “average.”
To find the ATR, we just need to collect samples of the true range day after day and average them out. This is a moving average, meaning on each successive day, we drop the oldest measurement from our set and incorporate the new one.
You can use a number of different period lengths in order to calculate such a smoothed average, and the right answer for you will depend on your trading style. The most common is the 14-day period.
Let’s take a look at what kind of trading strategies we can use with the ATR.
Trading Techniques
While the ATR is an incomplete trading tool on its own, there are a number of techniques that the ATR can be used for that supplement overall trading systems.
Volatility bands
The ATR calculation returns a volatility figure that can be used to calculate limits around an asset’s current price that indicate a measure of its recent average volatility.
If these limits are breached, it may be an indication that volatility is surging. This could inform your risk management framework if you were thinking about trading the asset.
Volatility-based stop losses
Stop losses are a type of predetermined exit position which are very useful if you don’t have the opportunity to monitor all your positions in real time.
A volatility-based stop loss can be determined based on an asset’s recent volatility. If the asset’s volatility has risen, it may be an indication that some fundamental information has shifted in the asset.
This type of technique can be beneficial for traders who want a dynamic stop loss strategy since the ATR will update with time.
Volatility-based position sizing
Position sizing is a core part of risk management since you don’t want to risk too much on one trade.
The ATR can help us size positions intelligently. Think about it – if you’ve identified an entry signal, would you be willing to allocate more capital if it was a low-volatility asset or a high-volatility one?
Since low-volatility assets are often perceived as less risky, the likely answer is a low-volatility asset. The ATR can help us quantify this intuition by helping us calculate sizes outright.
Of course, what that exact calculation looks like will depend on the individual trader.
Case Study
Let’s walk through a basic example of how we might put the ATR into practice.
Suppose we’ve identified a potential uptrend in NVDA stock using a trendline-based indicator. Now, we want to make sure we have a dynamic stop-loss strategy in place so we don’t lose too much money if we’re wrong.
- Calculate the recent ATR. Suppose we’re using the common 14-day day smoothing period. Then, for the past 14 days, we’d calculate the three figures described earlier in this article, taking the maximum value for each day. Then, we’d average this to find the ATR. Suppose the ATR for NVDA is $5.
- Decide on an ATR multiple. Now, we know that the ATR is the stock’s recent average volatility. So, if we want to sell our position if we’re worried that volatility is spiking, we’ll need to decide on how much volatility is too much. 1.5x is one common figure, so let’s use that. Our 1.5x ATR limit is $7.5.
- Calculate the stop loss limit. Suppose NVDA is trading at $100. Then our stop loss would be set at $92.5. That’s the price that would indicate a substantial spike in volatility, and would therefore necessitate us selling the position.
- Dynamically update our limit over time. Of course, the ATR doesn’t stay fixed. As time passes, we’ll need to ensure that we update our calculation so it stays accurate. This also means that we’ll need to update our stop loss trade to stay in line with our risk tolerance.
The ATR is best used as a risk management tool with other indicators, but this case study provides a simple example of how it can be used to calculate certain risk limits.
Potential Risks
The ATR isn’t a one-stop shop for risk management. There are several limitations you need to be aware of if you’ll be using this calculation in practice.
Timeframe dependent
Imagine if there were a sudden spike in volatility over the course of 15 minutes, with prices surging before quickly falling back down. If you were only using 30-minute ticks, then you’d completely miss this volatility jump. It’s important to use multiple timeframes in your calculations to get a true measure of volatility.
No directional information
Suppose a stock has jumped from $1 to $5 to $10, all in the span of a couple of days. In all likelihood, this would be captured as a very high volatility figure. But while high volatility is often perceived as a risky thing, this stock could very well be climbing based on great fundamental information.
Operates purely on price information
On the back of the previous risk, we must remember that the ATR, like many other technical indicators, only incorporates historical price information.
There could be many sources of higher volatility that are not captured by prices. For instance, suppose a stock will be impacted by an upcoming announcement by a CEO. This would contribute to future volatility, but wouldn’t be captured by past price data at all.
Conclusion
In many ways, the ATR is unlike many other indicators traders may have seen.
That’s because it doesn’t give you any information about the likely direction an asset’s price might be taking. Instead, it merely summarizes what the asset’s overall recent volatility has been like.
However, the ATR is also like other indicators in some ways. Most notably, it should not be used on its own. Rather it should be incorporated into an overall trading strategy as one part of a risk management framework.
Ultimately, deciding whether or not to use ATR is up to you and your trading strategy. But once you’ve grasped the basic calculation, you can quickly incorporate the indicator to see if it’s right for you.
FAQs
How to read average true range indicator?
The ATR doesn’t always lend itself to an easy interpretation. But, in essence, a higher ATR means a stock has been moving around a lot more recently (which could indicate higher risk), while a lower ATR means the opposite.
How to use the average true range?
The ATR can be used in a couple different ways. You could calculate volatility bands around an asset to identify when it has become more volatile, or you could use it to size your positions based on your risk tolerance. Finally, you can use the ATR to calculate an appropriate stop loss.
How to use average true range in forex?
The ATR is used in forex similarly to how it used in other markets. Basically, find the true range for a suitable period, average it, then use that figure as one component of your risk management framework. Be aware that non-price contributions to volatility, like geopolitics, are a big consideration in forex markets.
WeInvests is a financial portal-based research agency. We do our utmost best to offer reliable and unbiased information about crypto, finance, trading and stocks. However, we do not offer financial advice and users should always carry out their own research.
Read More