In the dynamic world of technical analysis, one crucial concept that traders often come across is ‘divergence.’ When paired with the Relative Strength Index (RSI), this concept becomes an essential tool, equipping traders with vital indicators of potential future price movements, particularly in the forex market. In this comprehensive deep dive, we will get into the intricacies of divergence and RSI divergence, specifically honing in on hidden divergence and bullish and bearish RSI divergence.
As we journey through this article, we will shed a light on the pivotal elements of divergence trading, its practical use-cases, and its strategic significance. From demystifying the core concepts to evaluating an array of strategies, techniques, and methodologies, we aim to provide an extensive panorama of divergence trading. Moreover, by leveraging real-world examples and detailed case studies, we will illustrate the practical application of these theories in a live trading context. To round off our exploration, we will address the potential risks, limitations, and important considerations that traders should factor in when incorporating divergence into their trading arsenal.
What is Divergence Trading?
Technical analysis is a fundamental aspect of trading and investment, and understanding divergence has become crucial in this context. Divergence occurs when the price trajectory of a security moves in the opposite direction of a technical indicator, such as the Relative Strength Index (RSI). There are two main types of divergence: regular divergence and hidden divergence.
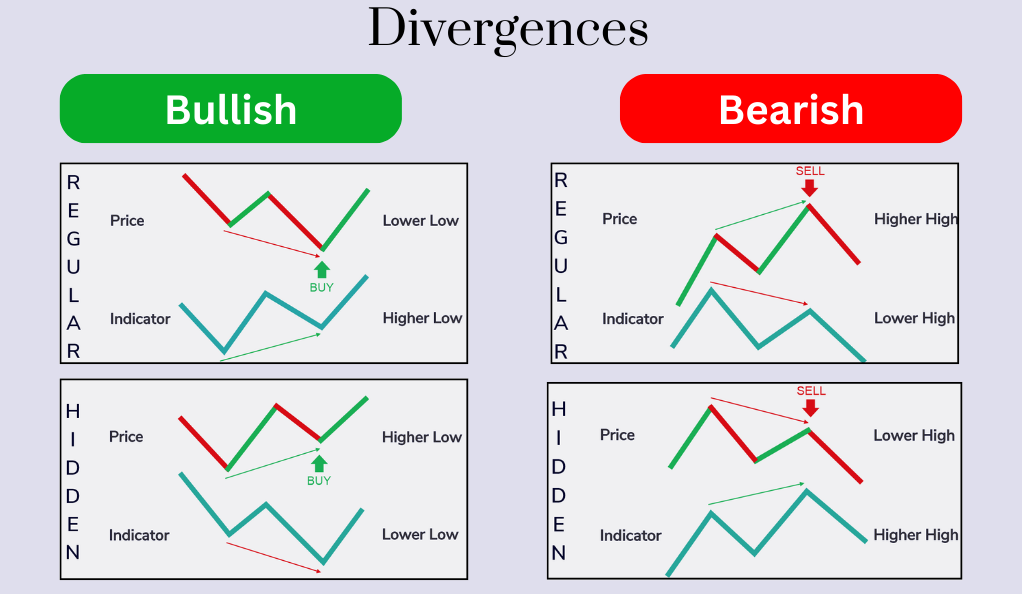
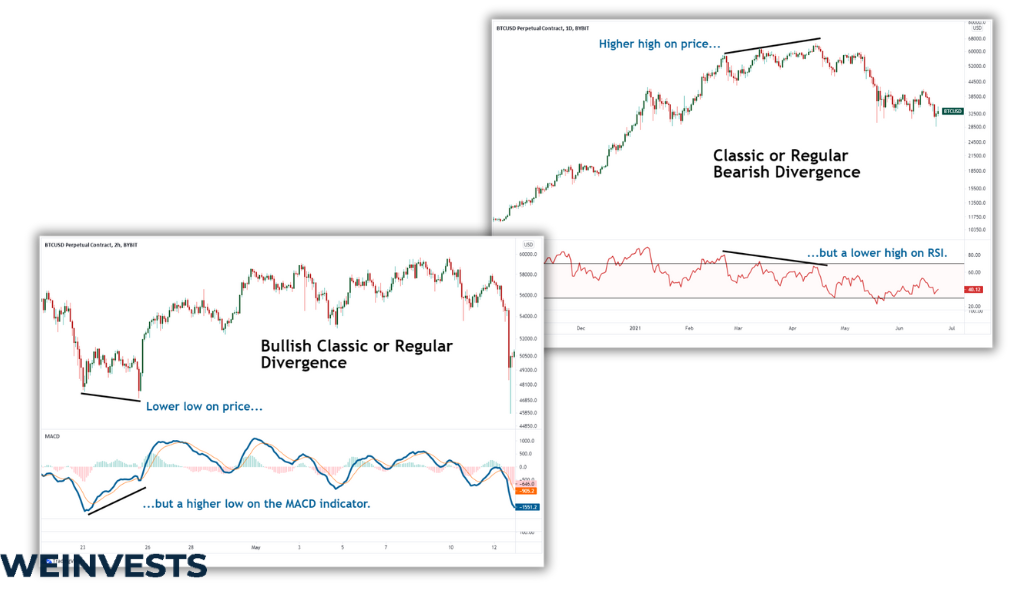
- Regular Divergence: Regular divergence is often seen as a signal for potential trend reversals. For example, when the price of a security continues to make new lows while the technical indicator, such as the RSI, starts to rise, it could indicate that the downward trend is losing momentum, and a trend reversal might be on the horizon.
- Hidden Divergence: The focus of this discussion is on hidden divergence, which is less well-known but equally significant. Hidden divergence signals a potential continuation of an existing trend, making it an integral part of trend-following strategies. Hidden divergence occurs when the price of a security and a momentum indicator, like the RSI, diverge in their directional movement. However, instead of suggesting a trend reversal like regular divergence, it indicates a trend continuation.
- Bullish Hidden Divergence: An example of hidden divergence is the bullish hidden divergence in the forex market. This happens when the price forms a ‘higher low’ (the low point of the current cycle is higher than the low point of the previous cycle), while the RSI forms a ‘lower low’. This suggests that despite a temporary pullback in price, the overall bullish momentum remains strong. It gives traders an indication that the uptrend is more likely to persist than to reverse. Recognizing these hidden divergences can provide traders with crucial insights into future price actions and uncover profitable trading opportunities.
Divergence is a significant concept in technical analysis, with two main types: regular divergence, signaling potential trend reversals, and hidden divergence, suggesting potential trend continuations. Understanding and recognizing hidden divergence can be beneficial for traders, enabling them to make more informed trading decisions and identify favorable market conditions for profit potential.
Key Concepts of Divergence Trading
Understanding divergence in the context of the Relative Strength Index (RSI) is vital for forex traders. The RSI is a momentum oscillator that measures the magnitude and speed of price movements, helping traders identify overbought and oversold conditions. When price and RSI move in opposite directions, it creates an RSI divergence, which can be of two types: bullish RSI divergence and bearish RSI divergence.
This type of divergence occurs when prices are steadily descending to form lower lows, but the RSI starts ascending and forms higher lows. The bullish RSI divergence signals the potential for upward price movement. Recognizing this pattern can serve as a powerful signal for traders to take a long position, anticipating that the price will continue its upward trajectory.
In contrast, bearish RSI divergence is identified when prices continue to make lower lows, while the RSI deviates and starts forming higher lows. This divergence suggests a weakening in the bearish momentum and acts as a warning signal for a potential bullish reversal. Traders may consider entering a long position or closing existing short positions in anticipation of an upward price movement to avoid potential losses.
Forex traders use various strategies and methodologies to identify and trade divergences, and recognizing hidden bullish divergence is particularly important in this practice. Traders look for instances where the price of a forex pair forms a higher low, while the corresponding RSI creates a lower low. This specific pattern can provide a strong signal for a good opportunity to take a long position, expecting the price to continue its upward trend.
Ultimately, understanding divergence in conjunction with the RSI is crucial for forex traders. It offers valuable insights into the mechanics of forex trading and acts as an essential toolset for predicting and reacting to market movements. By utilizing these methodologies, traders can make informed decisions based on the nuanced interplay between price action and technical indicators like the RSI, enabling them to navigate the forex market effectively.
Real-life Examples of Divergence Trades
Examining real-world occurrences of divergence in forex pairs helps bring the concept to life and showcases its practical value in forex trading:
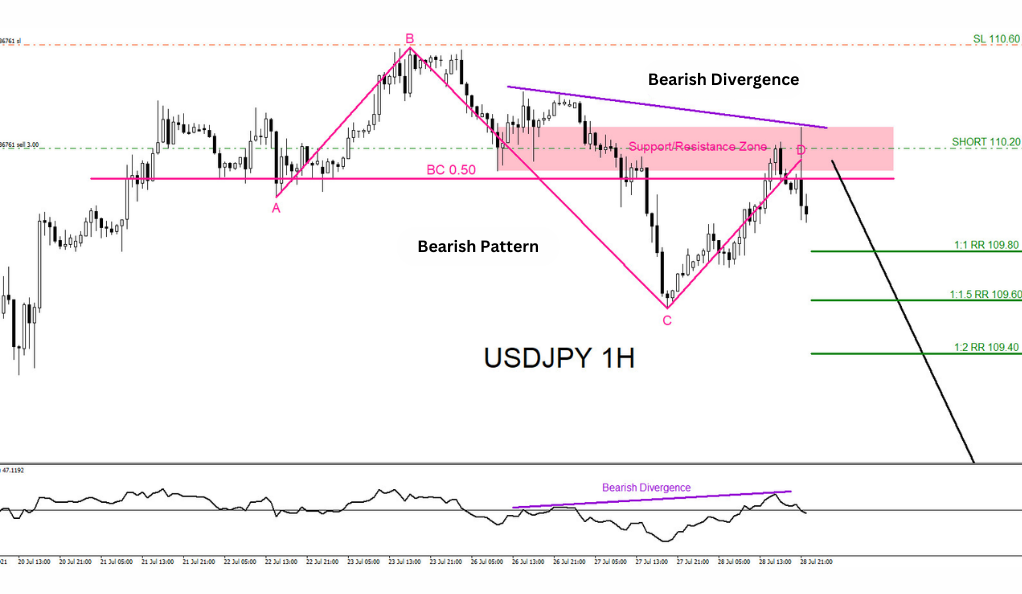
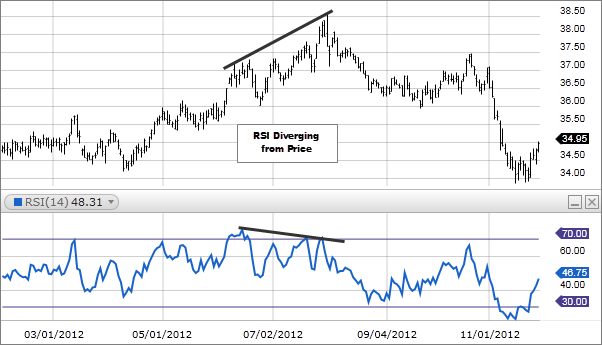
Bearish Divergence in USD/JPY Pair:
- In August 2022, amidst a consistent long-term uptrend in USD/JPY, a potential bearish divergence emerged. The pair’s price action continued to carve out higher highs, indicating the ongoing strength of the uptrend.
- However, the RSI, a key momentum oscillator, showed a contrasting picture by forming a lower low. This disparity between the rising price and the falling RSI was a clear indication that the uptrend’s momentum was waning, marking the first sign of bearish divergence.
- As we moved into October, the bearish divergence became more apparent, with the price pushing towards its final high, while the RSI remained subdued, further solidifying the divergence.
- By the end of December, the anticipated shift in trend materialized, and the once-strong uptrend in USD/JPY was broken. The pair’s price started to decline, confirming the initial signs of bearish divergence observed in August. Traders who identified this bearish divergence and positioned themselves accordingly could have profited from the subsequent downtrend.
Bullish Divergence in AUD/USD Pair:
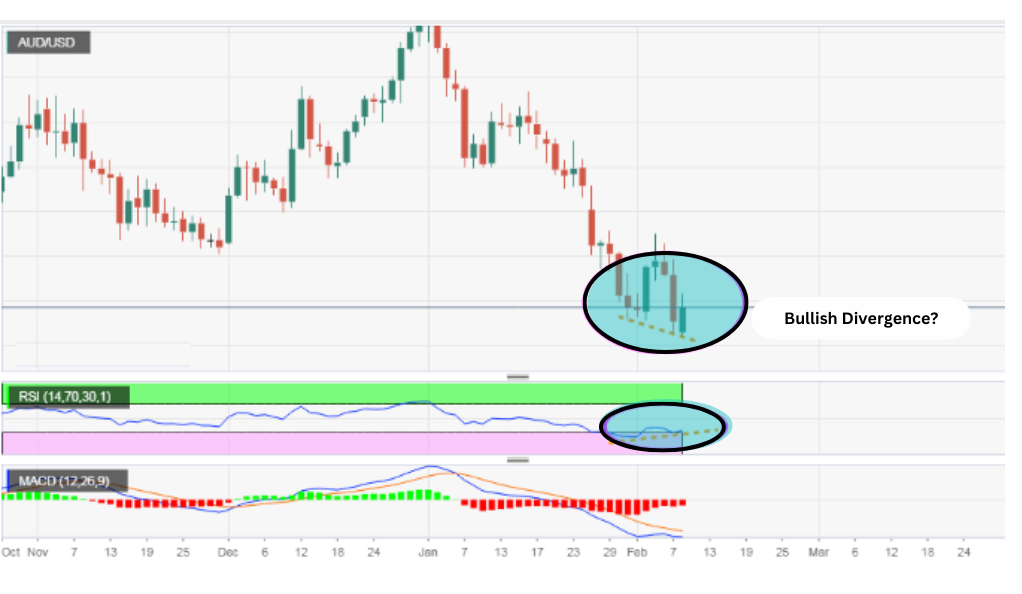
- In August 2022, AUD/USD was in a downward trend, with the price consistently forming lower lows, indicating a strong bearish sentiment.
- Simultaneously, the RSI was mirroring this action, also forming lower lows, which was in line with the prevailing price pattern.
- However, in October 2022, a potential bullish divergence emerged. Despite the continuation of lower lows in the price, the RSI presented a contrasting picture by forming the first higher high, deviating from the prevailing price pattern. This incongruity signified a potential bullish divergence, suggesting that the downtrend’s momentum might be weakening and a reversal could be on the horizon.
- This marked a turning point for the AUD/USD pair, as the price action started to reverse, and a new uptrend began. The shift in market dynamics persisted into the new year, and by January 2023, the pair had reached a new long-term high, providing a robust confirmation of the initial bullish divergence signal observed in October.
In conclusion, the real-world examples of bearish and bullish divergences in forex pairs demonstrate the practical value and predictive power of divergence in forex trading. Traders who can identify these divergences accurately can make informed decisions and potentially profit from significant shifts in market trends. Divergence serves as a valuable tool for forex traders to navigate market dynamics and identify potential entry and exit points.
Potential Risks of Divergence Trading
Like any financial instrument or technique, the application of divergences is not without its challenges or limitations. While divergences can offer essential insights into market direction and potential reversals or continuations, they are by no means foolproof or invincible. In fact, the predictive power of divergence should be used judiciously and in concert with other technical indicators and forms of fundamental analysis to validate signals and manage risk. Depending solely on divergences can lead to an incomplete understanding of market dynamics and potential financial pitfalls.
The Complexity of False Signals
One significant drawback with divergences is that they can frequently lead to what is known as false signals. These occur when a divergence is observed, suggesting a potential change in market trend, but the price continues its prior trend regardless of the divergence. This can result in misplaced trades and potential losses. For instance, a trader might observe a bearish divergence and, expecting a trend reversal, position themselves for a downturn. However, if the price continues to rise despite the divergence, the trader could find themselves in a losing position.
The Challenge of Timing Trades
Another limitation of divergence is the lack of precision it provides in terms of entry or exit points. This can pose a significant challenge for accurately timing trades. Unlike certain other technical indicators, divergence does not provide exact buy or sell signals. Instead, it hints at potential price movements, and the actual timing of these movements can be unpredictable. Therefore, while a trader might correctly anticipate an upcoming trend reversal or continuation based on a divergence, they may still struggle to accurately time their entry and exit points, which can lead to missed opportunities or less-than-optimal trade outcomes.
The Influence of Market Volatility
[Image highlighting large price moves around divergence that can complicate entries/risk management]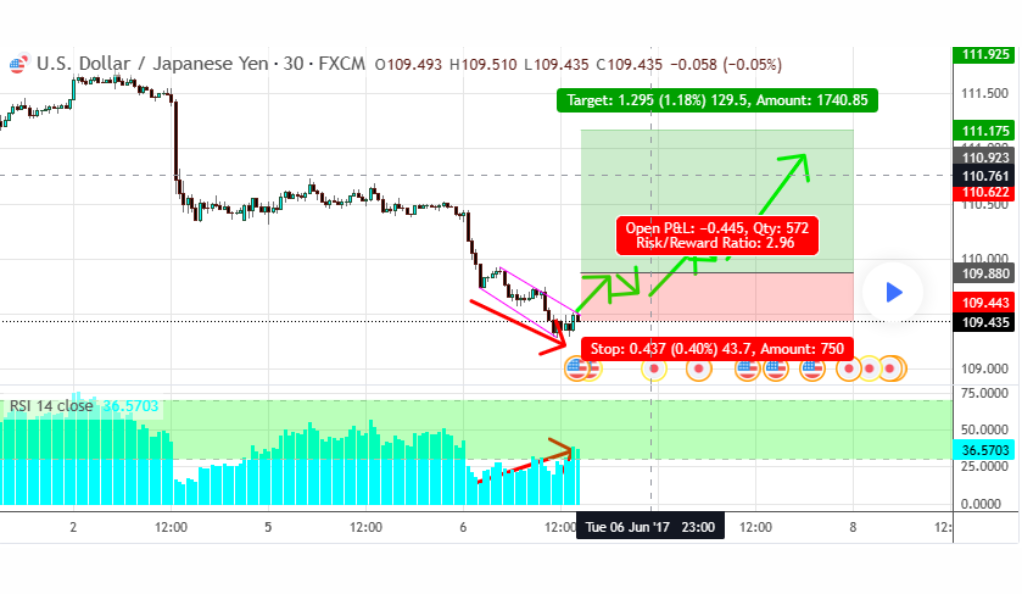
Additionally, the reliability of divergence as a predictive tool can be significantly affected by market volatility. During periods of heightened volatility, price and RSI can diverge for an extended period before the expected reversal or continuation eventuates. For instance, in an extremely bullish market, the price might continue to rise despite a bearish divergence, making it difficult for traders to accurately predict when the trend will reverse. This extended divergence can test the patience of traders and can sometimes lead to premature or delayed trading decisions.
The Necessity of Risk Management Strategies
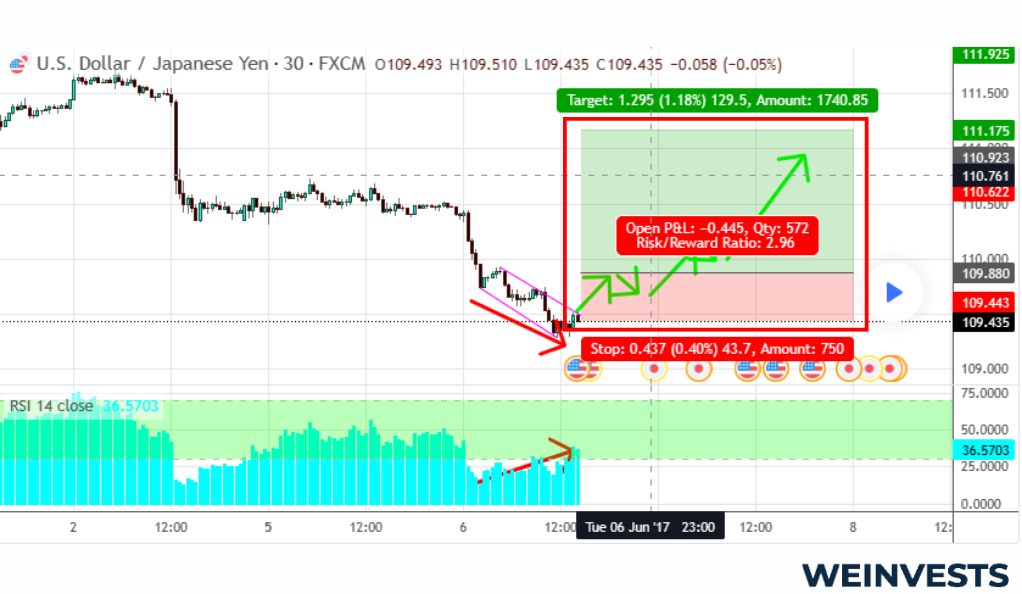
Given these risks and limitations, it becomes clear that traders using divergence as part of their trading strategy must implement robust risk management strategies to protect their capital from potential adverse market movements. One such strategy is the use of stop-loss and take-profit orders. A stop-loss order automatically closes out a trade at a certain price level to limit losses if the market moves against the trader’s position. Conversely, a take-profit order locks in profits by closing the trade when the market moves favorably to a specified price level.
Moreover, traders should also consider position sizing – limiting the size of their trade to only a small percentage of their trading capital – as another risk management technique. This can prevent the trader from losing a significant portion of their capital on a single trade if the market does not move as anticipated.
Risk tolerance and risk/reward ratio are other important considerations. Every trader has a different tolerance for risk, and this should be reflected in their trading strategy. The risk/reward ratio, which compares the potential profit of a trade to the potential loss, should also be favorable to ensure that the potential upside of the trade outweighs the potential downside.
In conclusion, while divergence can be a powerful tool in a trader’s arsenal, its limitations necessitate that it be used in combination with other technical and fundamental analysis tools, backed by solid risk management strategies. By doing so, traders can more confidently navigate the market and potentially increase their chances of successful trades.
Final Thoughts
Divergence trading, particularly when focusing on hidden divergence and RSI divergence, is a potent tool in a forex trader’s arsenal. A firm understanding of these concepts can equip traders to navigate the unpredictable waves of the market and make strategic decisions.
However, as with all trading strategies, divergence trading isn’t without its risks and limitations. Divergence can produce false signals, and market volatility can impact its reliability. As such, it should be part of a comprehensive trading strategy, reinforced by other forms of analysis and robust risk management techniques.
Looking towards the future, as financial markets continue to evolve, these technical analysis tools’ practical application and efficacy will remain a crucial area of interest for both novice and experienced forex traders. Divergence trading, through its deep insights into market trends, will undoubtedly continue to play a pivotal role in shaping trading strategies in the forex market.
FAQ
What is Divergence Trading?
Divergence trading is a trading strategy used in technical analysis that involves comparing the direction of an asset’s price movement with the direction of various indicators such as the Relative Strength Index (RSI), Moving Average Convergence Divergence (MACD), or other momentum oscillators. When the price of an asset is moving in one direction and the indicator in another, this is known as divergence. This can be a signal that the current price trend may be weakening and could soon reverse, providing potentially profitable trading opportunities.
What are the types of Divergences in trading?
There are primarily two types of divergences in trading – regular divergence and hidden divergence. Regular divergence is used to identify potential reversals in price. If price forms a higher high, but the indicator forms a lower high, it indicates a bearish regular divergence. If price forms a lower low, but the indicator forms a higher low, it indicates a bullish regular divergence. Hidden divergence, on the other hand, is used to identify potential continuations of the current trend. A hidden bullish divergence occurs when price makes a higher low, but the indicator forms a lower low. Conversely, a hidden bearish divergence is when price makes a lower high, but the indicator forms a higher high.
What are the risks associated with Divergence Trading?
Divergence trading, like all trading strategies, carries risk. One key risk is that a divergence can sometimes be a false signal, leading to a trade that goes against you. Divergences are also more subjective compared to other technical analysis methods and can be harder to identify correctly. Moreover, they typically don’t provide clear price targets or stop levels, which can make trade management more challenging. Additionally, divergence is better used as a confirmation tool in combination with other trading techniques, rather than a standalone strategy. Always remember that while divergence can hint at potential reversals or continuations, it does not guarantee them. Proper risk management, including stop-loss orders and position sizing, remains crucial in all forms of trading, including divergence trading.
WeInvests is a financial portal-based research agency. We do our utmost best to offer reliable and unbiased information about crypto, finance, trading and stocks. However, we do not offer financial advice and users should always carry out their own research.
Read More