The MACD (Moving Average Convergence Divergence) is a type of technical indicator used to time buying and selling for certain trading strategies.
This indicator is popular, simple to calculate, and can be used to trade a wide variety of assets. The MACD works by comparing an asset’s performance over several recent time periods to determine if it will rise or fall in the near future.
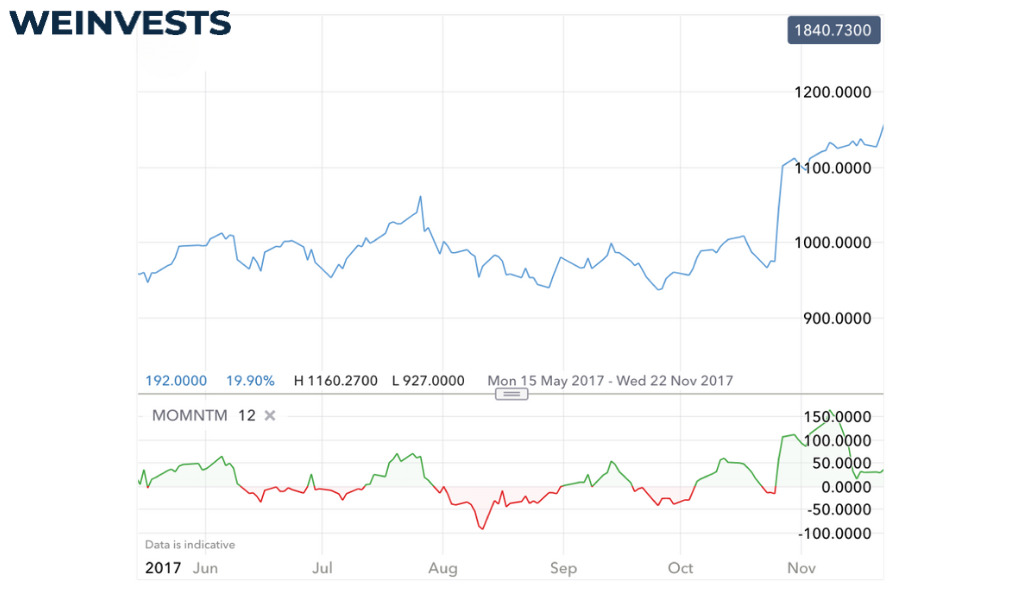
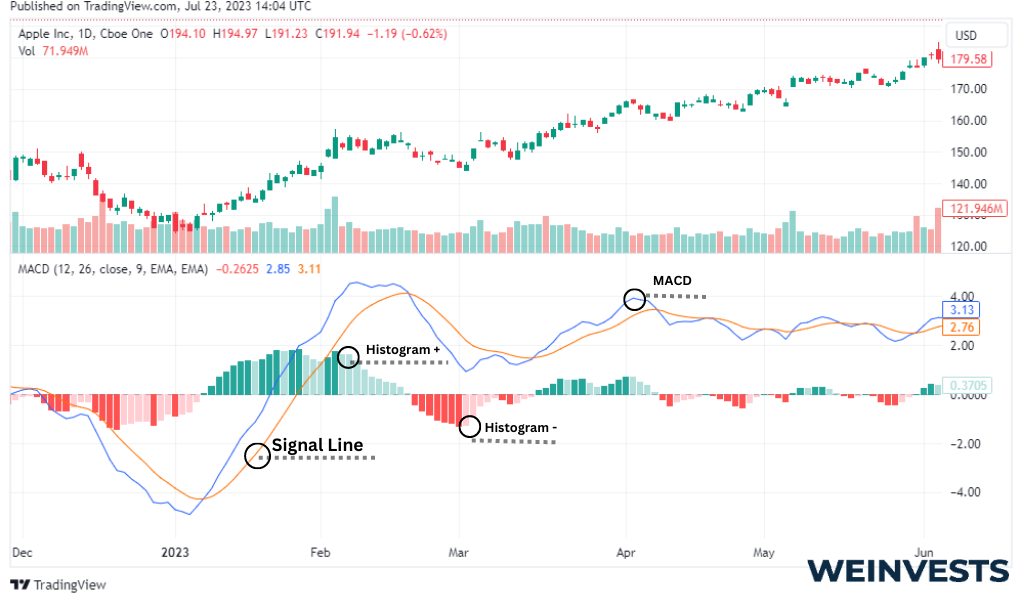
The MACD consists of three basic components.
- The MACD line, which reflects the speed at which the asset price is rising or falling.
- The signal line, which shows the recent average behavior of the MACD line.
- A histogram, created by subtracting the signal line from the MACD line.
While having three components of one indicator can seem intimidating, the MACD is quite intuitive in practice. In this article, we’ll show you how you can start using this powerful indicator in your trading strategy.
First, we’ll go over a thorough explanation of how exactly the MACD works. Then, we’ll take a look at some trading strategies you can use to most effectively utilize this indicator. Of course, we’ll also highlight some of the key risks you’ll need to pay attention to.
Let’s get started.
Detailed Explanation
Before putting real money to work based on the MACD, it’s important to fully understand the indicator. As we mentioned, there are three components to the standard MACD.
The first, the MACD line, shows the difference between an asset’s most recent performance and its semi-recent performance. Using the most common settings, a typical MACD line is an asset’s 12-day exponential moving average subtracted by its 26-day exponential moving average.
An exponential moving average (EMA) calculates an asset’s average performance over some time period but weights the most recent performance highest. In other words, information from yesterday is considered more relevant than information from a week ago.
The MACD line is positive if the 12-day EMA is higher than the 26-day EMA, indicating the short-term trend in the stock is positive. Conversely, the MACD line is negative if the short-term trend is negative.
The signal line is simply an EMA of the MACD line itself. Typical MACD settings have a 9-day EMA for the signal line.
The signal line incorporates the same information as the MACD line but at a slower pace. This steadier, smoother line can therefore indicate true changes in the longer-term price behavior of an asset. This is in contrast to the MACD line, which is more influenced by short-term movements.
If the MACD line crosses above the signal line, this could indicate positive momentum by showing the short-term average is higher than the long-term average. This is a similar interpretation to positive figures in the MACD line itself.
The histogram is the last major component of the MACD. The histogram is just a visualization of the ongoing relationship between the signal line and the MACD line.
This chart is created by subtracting the signal line from the MACD line. Although the histogram does not offer new information to a trader, it can make bullish and bearish signals easier to identify.
Key Concepts
There are a couple of key concepts that traders should understand before using MACD in their trading. Some of these are general trading concepts that apply to MACD, while others are specific to the indicator.
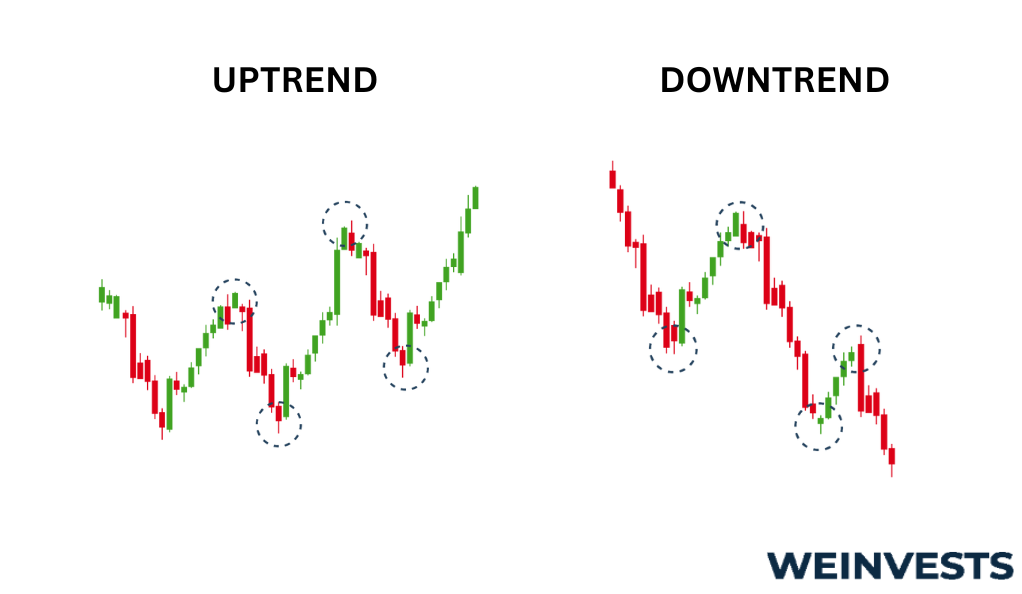
Trend
Trend is an important technical trading concept. It refers to whether the price of an asset is rising or falling, a process that might either continue or reverse.
Various factors are used to determine if a trend will keep going or not. One of these factors is momentum.
Momentum
Momentum is the speed or strength of an asset’s trend.
Even though an asset’s trend might be positive, it could be supported by very little trading volume. Alternatively, the positive trend could be playing out very slowly.
Momentum captures the idea that not all trends are the same. Some are stronger than others.
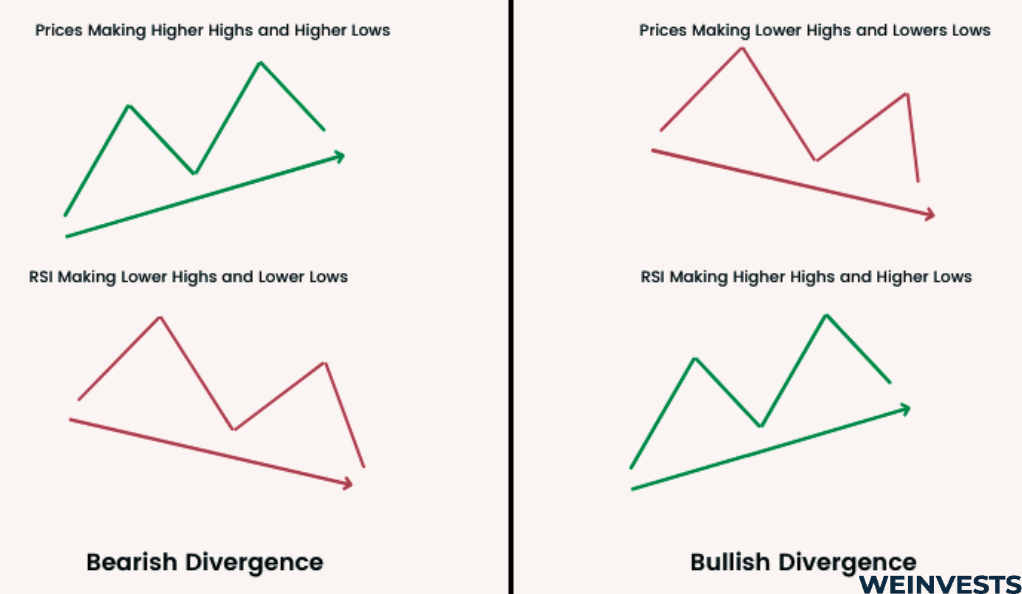
Divergence
Divergence refers to the situation in which the asset price and a technical indicator are not moving in tandem. In this case, the MACD line is our technical indicator.
Divergence indicates a potential trend reversal. If the price is declining, but the indicator is not, that’s a bullish divergence. If the price is increasing, but the indicator is not, that’s a bearish divergence.
Crossovers
Crossovers are an important component of using MACD. They occur when one line ‘crosses over’ another.
Part of what makes MACD so powerful is the incorporation of different indicator lines, rather than relying on just one. Whenever a line crosses another, traders should be aware of what it could mean as far as a potential signal.
Some crossovers are ideal for identifying trend shifts and others for changes in momentum.
Strategies and Techniques
We’ll briefly cover some of the most common strategies and techniques in this section. Bear in mind that successful MACD traders generally use a combination of these strategies.
Divergence trading
Let’s say that the price is declining, but the MACD line is not. This could be a bullish divergence sign for the stock.
The MACD line is positive when the short-term trend is positive. If the MACD line is moving sideways or increasing, then it means that the asset’s general trend is not truly getting worse.
This could mean that the price decline does not have strong momentum and could reverse, which is a bullish signal for the asset.
Even in this simple example, you can see how trend and momentum can be combined for powerful trading.
Crossover trading
Crossovers are important signals for MACD trading strategies. There are two crossover types that MACD traders focus on.
The first type of crossover is the signal-line crossover. This occurs when the MACD line (the ‘fast’ line) crosses the signal line (the ‘slow’ line). This could be an indication that the asset’s trend is accelerating.
If the MACD line crosses the signal line from below, that’s a bullish sign, indicating that the asset’s positive trend is gaining momentum. Of course, the reverse is a bearish indicator.
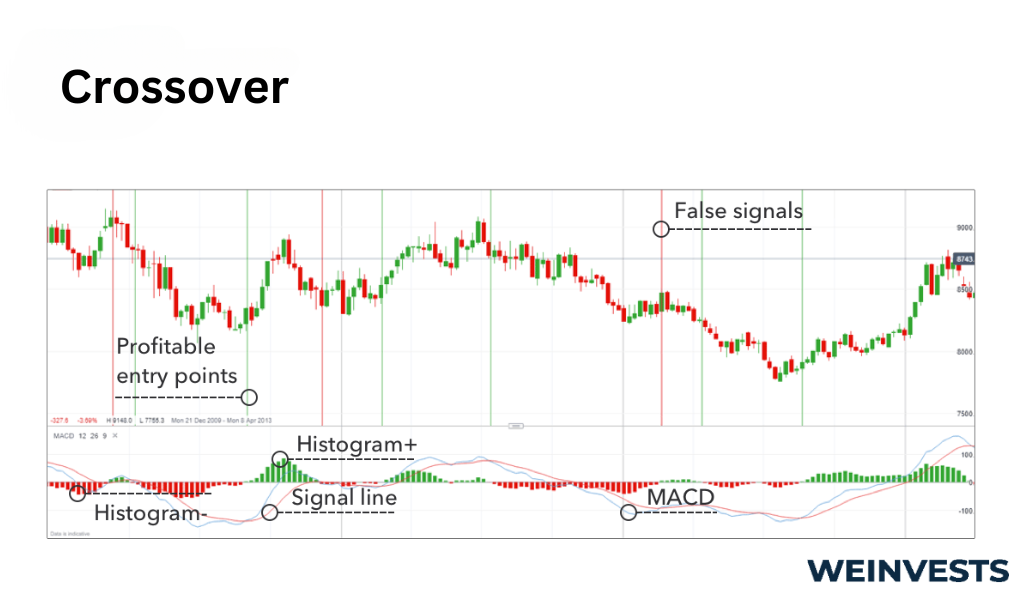
The second type of crossover is the zero crossover. As the name indicates, this occurs when the MACD line crosses zero.
If the MACD line goes from positive to negative, this is a bearish sign. It could signal the start of a downtrend.
On the other hand, the MACD having a zero crossover and becoming positive is a bullish signal.
Histogram reversals
The histogram is an important visual indicator of momentum for traders.
When the MACD line crosses above the signal line, that’s known as a signal-line crossover. What will also occur is that the MACD histogram will flip from negative to positive. The higher the MACD line gets above the signal line, the larger the histogram will be.
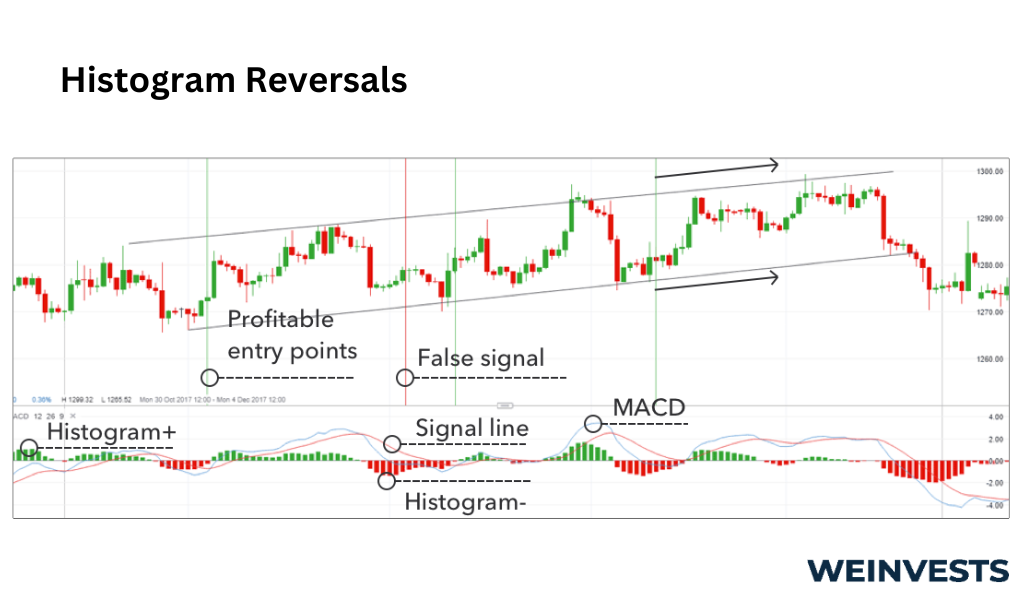
Since the MACD line is the ‘fast’ line, registering trend shifts quicker than the ‘slow’ signal line, a growing histogram indicates strong positive momentum. On the other hand, a shrinking histogram, which threatens to enter negative territory, is a bearish sign of poor momentum.
MACD Case Study
To see how MACD would work in practice, let’s go through a simple case study of trading AAPL stock.
- Setup: You notice that AAPL has been in a downtrend for several weeks. You decide to use your MACD tools to analyze the downtrend and monitor for any potential reversals.
- Divergence Buy Signal: After monitoring AAPL, you notice that the downtrend in price is no longer matched by a falling MACD line. This is a bullish divergence, indicating that the price action does not have strong momentum.
- Crossover Buy Signal: As the trend reverses and AAPL starts to climb, you wait to enter the trade to ensure there is good momentum behind the movement. You get this signal when the MACD line breaks out through the signal line from below. This indicates AAPL’s positive momentum is increasing.
- Entry: You purchase AAPL and monitor your position for further movements.
- Crossover Sell Signal: After sitting on your position for a while and seeing AAPL climb, you see that the MACD line just made a zero crossover from above. You recognize this could signal the start of a downtrend.
- Exit: You exit your position, realizing a handsome profit from buying low and selling high.
Of course, not every trade will go so smoothly, but this case study shows how multiple signals can be used to trade most profitably.
Potential Risks
In finance, there are no rewards without bearing some risk. Before you dive into using MACD, let’s review some of the potential risks you need to be aware of.
False signals
This is a major risk of using any technical indicator, especially MACD. Sometimes, despite a signal being theoretically bullish or bearish, the trend does not play out in practice.
Several strategies exist to mitigate false signals.
First, don’t rely on just one signal. For this reason, the existence of multiple lines and strategies with MACD is partly what makes it so powerful.
Second, pay attention to the strength of a signal. Assets fluctuate often in financial markets, so don’t take a brief crossover as a sign of something big. Ensure that the signal is maintained before acting on it.
Non-price information
MACD only incorporates price information when giving signals. The source for the MACD line, the signal line, and the histogram is simply price data.
As any veteran trader will tell you, the price doesn’t tell you the whole story. Sometimes, expected volatility is higher than anticipated due to geopolitical factors. Rumors of a merger could cause a stock to shoot up as well.
The core lesson of this risk is to ensure that you don’t develop tunnel vision by just looking at charts. Incorporate non-price information into your trading strategy.
Market dependence
Finally, MACD does not work equally well in all markets. While the general theory behind the system is robust, practical considerations about market structure must be taken into account.
For instance, a very low-volume commodities market might not be the best place to use MACD. The lack of liquidity could lead to rapid price adjustments which cannot be captured in the lagging information of the MACD and signal lines.
Alternatively, consider a bond market that moves quickly on political news. Since there is so much non-price information that could impact returns, MACD might be inappropriate.
Conclusion
While using MACD comes with several potential risks that traders should be aware of, the overall indicator system is robust and powerful.
By combining information about both trend and momentum, traders can make better decisions than considering just one factor in isolation. The three components of MACD, namely the MACD line, the signal line, and the histogram, can help you identify signals quickly.
The popularity of MACD also makes it a good choice for traders. Many popular trading systems likely incorporate the calculations already, making it a simple choice to get up and running quickly.
As traders gain experience, though, they often develop their own systems to achieve the best returns. Even if you don’t use all aspects of MACD, several concepts from the system may prove to be real difference markers for your trading. This is a powerful motivator to experiment with MACD, just as you experiment to find your optimal strategy every day.
FAQ
What is the best MACD strategy?
There is no single way to use MACD that is best. The optimal strategy will depend on your unique trading style. However, it’s important to leverage the strength of MACD by incorporating different signals into your trading. That includes using crossover, divergence, and histogram signals.
What are the best MACD settings?
The best MACD settings will depend on the market you’re in and the way you trade. For example, in a quick-moving market, it might make more sense to use a (5, 10, 5), where the notation indicates the periods for (Fast EMA, Slow EMA, Signal EMA). The standard settings are (12, 26, 9).
When should I use MACD?
MACD is a powerful tool, but it’s probably not appropriate for all markets. You should use MACD if you’re confident you can identify false signals, if you’re operating in a liquid market with high volume, and if there is little reason to think that non-price information will noticeably affect your asset in the short term.
WeInvests is a financial portal-based research agency. We do our utmost best to offer reliable and unbiased information about crypto, finance, trading and stocks. However, we do not offer financial advice and users should always carry out their own research.
Read More