If you’re a technical trader, you’re probably familiar with the concept of trend lines. Basically, a trend line is a line drawn between two price points that’s used to verify a trend in the price of an asset.
Sounds simple, right?
Well, that simplicity can be deceiving. While anyone can start drawing lines haphazardly on a chart, using trend lines effectively takes skill, practice, and understanding.
But when you use them properly, trend lines can be a phenomenally useful tool when it comes to identifying how an asset’s price is likely to behave.
More than that, trend lines are versatile. Few other technical trading tools can be used in as many different trading strategies as trend lines can.
But in today’s article, we’ll go over the fundamentals. We’ll see how to use a simple set of trend lines to identify anticipated price movements, and how we can use the tools of trading to profit from our analysis.
Once you’ve mastered the basics, you can truly unleash the power of trend lines. Let’s get started.
Detailed Explanation
The utility of trend lines is captured in one simple statement about finance: The trend is your friend!
If an asset is trending in a certain direction, we shouldn’t try and fight it without a good reason. Instead, we can go along for the ride and earn ourselves a tidy profit in doing so.
Of course, you’ll need to identify when an asset has begun to trend in a certain direction. That’s what trend lines are for.
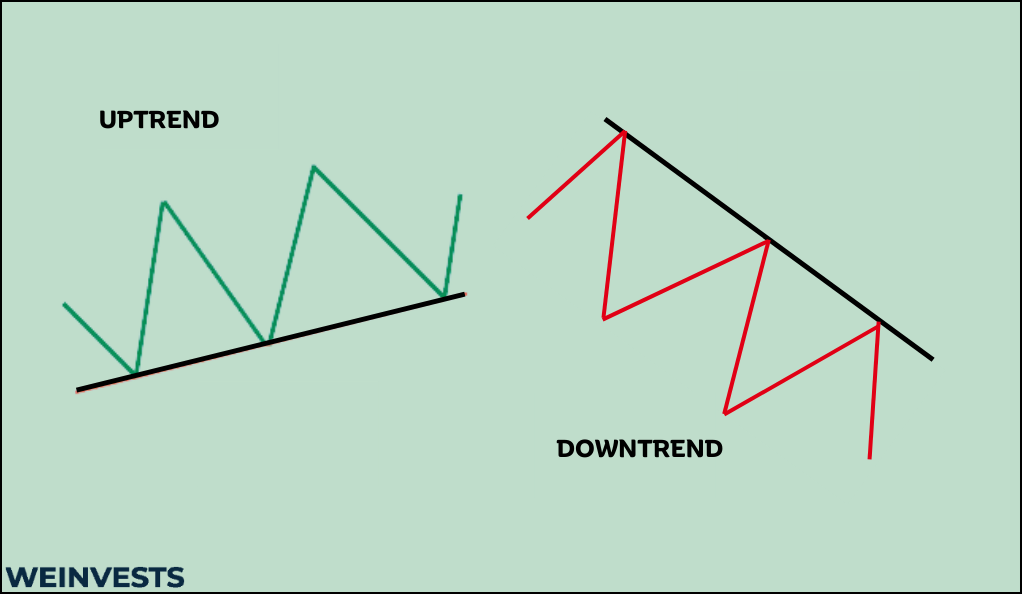
At an intuitive level, assets can either trend up, or they can trend down. Fittingly, these situations are known as “uptrends” and “downtrends.”
Uptrends
In an uptrend, the price of an asset is generally increasing. Now, there could be some retracement, in which an asset falls back down for a period of time and “retraces” a lower level. In fact, many trading strategies are based on that exact situation occurring.
But an asset in an uptrend will be climbing higher and higher, despite any brief slowdowns.
We can identify an uptrend if an asset has a series of higher highs and higher lows. In practice, that means that even though an asset may be bouncing around a lot, both its peaks and troughs are increasing with time.
To identify an uptrend with a trend line, you’ll need to identify some significant highs and significant lows in a rising asset. How significant these must be will depend on your trading style and the time length of your chart. But short, choppy movements should be excluded for a robust trend line.
Draw a line that connects the lows (also known as the troughs) of the asset. To be robust, your line should hit at least three significant lows on the price.
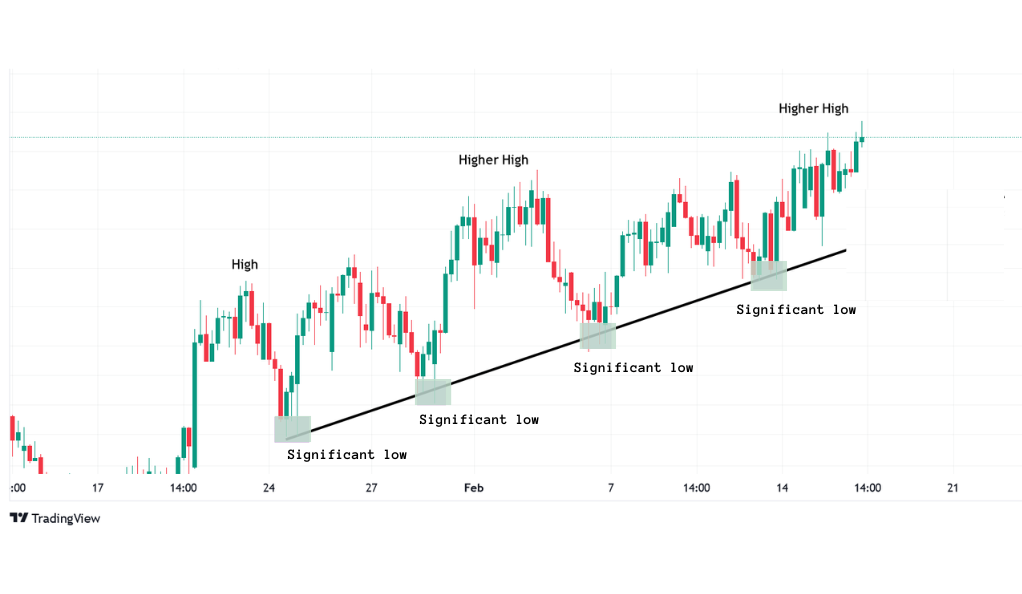
Then, extend that line out. This should give you an indication of where the trend will carry the asset in the near future.
A similar process is used to identify a downtrend.
Downtrend
Of course, if an asset in an uptrend is increasing, an asset in a downtrend is decreasing.
Again, this price behavior is general. Just like an uptrend, a downtrend can certainly have some periods of retracement.
To identify a downtrend with a trend line, you will once again need to identify a series of significant highs and lows in a falling asset. Just as with an uptrend, there is some discretion to this process.
An asset with a downtrend will have a series of lower lows and lower highs.
With a downtrend, the standard practice is to draw your line through the falling highs of the asset. Again, about three significant highs should be robust.
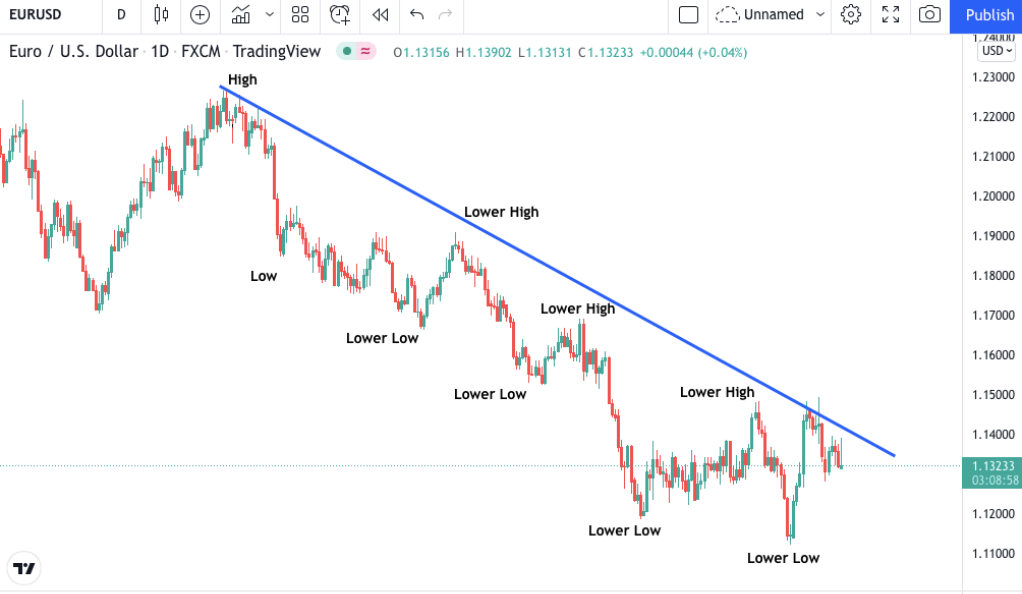
Once again, you can extend the line to see anticipated price action in the trending asset.
Now, you might be wondering: why do we have to draw our lines with the rising lows in an uptrend and the falling highs in a downtrend?
Well, the answer takes us to a couple key concepts that you’ll need to understand to effectively use trend lines.
Key Concepts
If you’re going to effectively use trend lines, you can’t just follow the instructions from a pre-existing trading strategy. Profitable trading requires being able to adjust on the fly as the market shifts.
To do so, you’ll need to integrate some key conceptual ideas about trend lines into your thinking.
These concepts even extend beyond trend lines and can be used for a wide range of technical trading strategies, so they’re well worth your time to study in detail.
Support
A support area is a price level that an asset struggles to fall below. There are different theories as to why support levels exist, but technical traders frequently utilize them in practice.
Suppose a stock is trading just above $100. While it may climb and fall over the course of the day, it rarely dips below $100. If it does, then it usually pops right back up above it. In this case, $100 is a support area.
But support lines are not just fixed. They can also be a trend.
For instance, if you draw an increasing trend line and see that a stock rarely falls below the line during its increase, then that increasing trend line is a support area.
That answers our earlier question about why uptrends need to be drawn using rising lows. If we know where an asset has some measure of support, using low prices, we can confidently enter a trade at that support level.
Resistance
Resistance, of course, is the inverse of support. When an asset encounters a resistance level, it struggles to break through that level.
To use a similar example to before, imagine a stock that’s trading just below $100. While the stock may occasionally have increasing periods, its price rarely eclipses $100. If it does, it falls quickly back below.
In this case, $100 would be a resistance level. Resistance levels are frequently used when we draw a downtrend trend line.
The reason why is that the lower highs we’ve drawn our line through identify resistance areas at which an asset will struggle to move above. So, we can bet against the stock at that level, with the belief that the asset won’t rise above it.
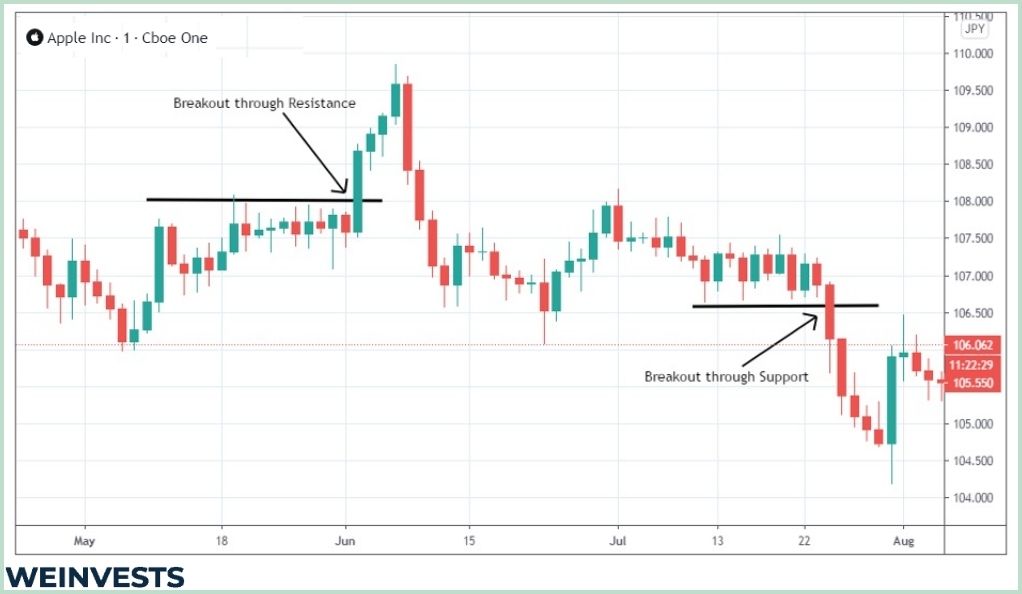
Breakout
The final key concept is a breakout. This occurs when a support or resistance level has failed.
While support and resistance may exist for an asset, they don’t last forever. Whether that level is a fixed price or an increasing/decreasing trend, traders must be aware of when the level no longer applies.
Breakouts can be bullish, in the case of when a resistance level is cleared. They can also be bearish, which occurs when a support level no longer buoys an asset.
We can identify a breakout when an asset repeatedly violates an existing support or resistance level – this also usually indicates the start of a new trend, which another trend line can help identify.
Strategies and Techniques
As we’ve discussed, trend lines can be a vital tool to use in complex technical trading strategies. On their own, they can be somewhat limited, but you can still use them as the foundation of a trend following trading strategy.
Trend Following
Unsurprisingly, trend lines are very useful for trend following strategies.
A trend following strategy is used when a trader bets that a current trend will continue into the future. For instance, if a stock is going up, you might bet that it will continue going up by going long.
Trend lines can indicate uptrends and downtrends on an asset. The more closely the asset’s price action hews to the trend line you draw, the more confident you can be that you’ve identified a real trend.
Of course, you’ll need to know when to exit the trade. As we covered in the previous section, trend lines can be used as support or resistance indicators, and you can sell out of your position when a breakout occurs.
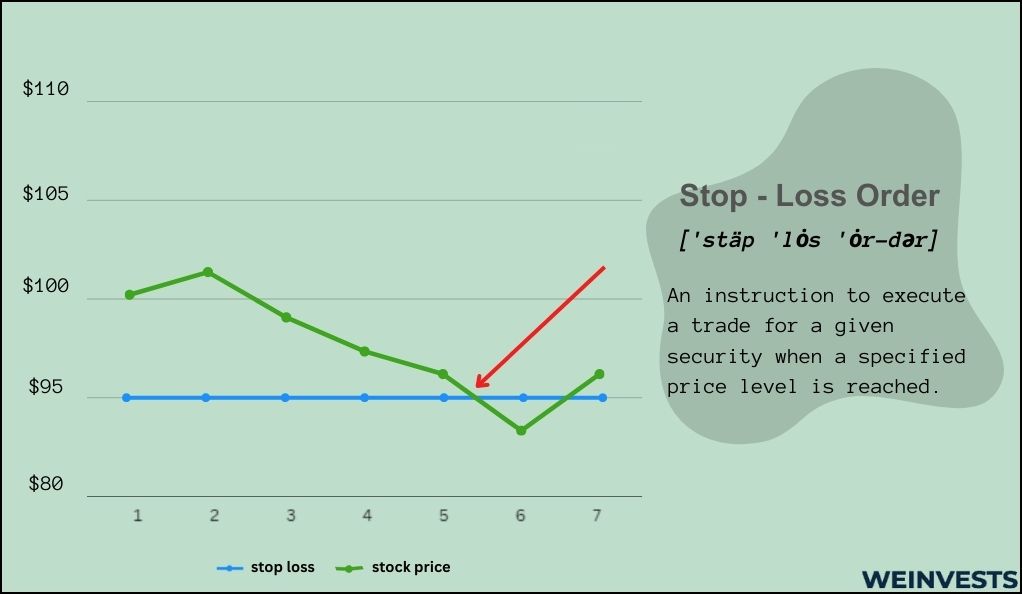
To automate exiting the trade, you can use the support/resistance trend line to enter a ‘stop loss,’ which automatically sells the asset when a price level is reached.
You may want to set the stop loss slightly below the trend line so that you can be sure a breakout has occurred.
Case Study
Let’s take a look at a simple example of using trend lines as part of a trend-following strategy.
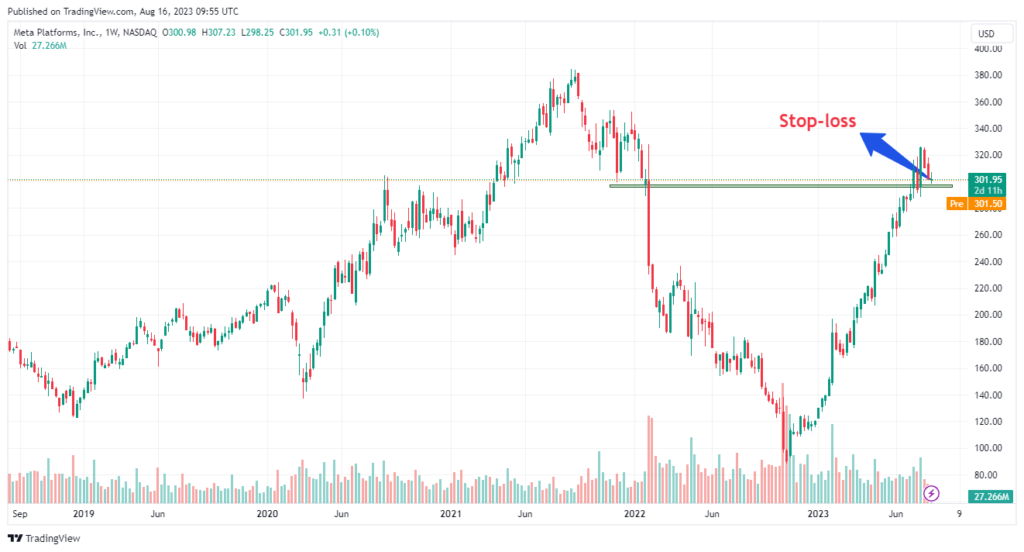
- Use trend lines to find a stock with an actionable trend. Typically, technical traders will monitor charts of multiple stocks to find one that looks tradeable. Let’s suppose we’ve identified a possible intraday uptrend on META using a high-frequency chart.
- Confirm the trend with a trend line. Once we’ve identified META as a possible trade, we’ll want to draw a trend line using a mix of manual processing and automated software. By drawing the trend line, we can confirm that the trend really exists.
- Enter the position. In this case, since we have a bullish trend, we will go long by purchasing the stock. Suppose we’ve entered the trade at $300.
- Set a stop loss. Using our trend line, let’s say we’ve identified $297 as a price level that is far enough below the trend to indicate a bearish breakout of a support level.
- Adjust stop loss over time. Of course, as the stock increases along the uptrend, we’ll need to adjust our stop loss to compensate. That’s because the support level increases with time as the uptrend does. In this case, maybe we’ve adjusted it to $305.
- Exit the trade on breakout. Once the stock has broken through the support level, that means the trend is likely over. We can sell out of our META position. Note that we may want to sell before our stop loss is violated since we typically set stop losses low enough to confirm a real breakout before an automatic trade is executed.
Potential Risks
While the META trade in our case study went pretty well, there are risks to using trendlines in the real world. We’ve covered some of the major ones for you below.
- Trend can be subjective. There’s a risk that a trend you’ve “identified” using a trend line does not actually exist. This can occur if a trend is strong enough for you to draw a line on, but may not have the strength to continue. You can minimize this risk with other technical indicators and by having sufficient trading experience to identify real trends.
- Breakouts can be misleading. While we’ve noted that you’ll want to see repeated violations of a support and resistance level to claim that a breakout has occurred, breakouts of all stripes can be misleading. Sometimes, a breakout swiftly reverses and the trend continues. Other times, a trend fails with no warning at all.
- Lines only incorporate price information. This is a major risk of trend lines if other technical indicators are not used to supplement their use. Trend lines rely almost entirely on price information, but other figures like volatility, liquidity depth, and correlation to other assets matters as well.
Conclusion
Clearly, trendlines are not a complete solution as a technical trading strategy. They are best used in conjunction with other technical and non-technical indicators in order to minimize the risks associated with them.
However, there are some foundational trading strategies and techniques that rely on using trend lines, most notably trend following. Moreover, trend lines themselves serve as a component of more complicated trading strategies.
So, although they are typically not sufficient on their own, every technical trader should spend their time studying and learning about trend lines.
FAQs
How to use trend lines in trading?
There are a lot of different ways to use trend lines in trading. Most notably, they can be used as part of a trend following strategy to indicate when a trend is occurring. They can also be used more generally to identify support and resistance levels.
How to draw trend lines?
If you’re looking at an uptrend, you would connect the rising lows, while a downtrend would call for connecting the falling highs. If you’re creating a channel, you might end up using both lows and highs to create two separate trend lines.
What is trend line breakout?
A trend line breakout occurs when a trend is starting to fail, and “breaks through” a trend line. A breakout can denote a bullish or bearish trend, depending on whether a support or resistance level was broken through.
WeInvests is a financial portal-based research agency. We do our utmost best to offer reliable and unbiased information about crypto, finance, trading and stocks. However, we do not offer financial advice and users should always carry out their own research.
Read More