Have you ever been trading and felt like a stock’s trend was “losing steam” and about to reverse?
This kind of intuition, to tell when an asset is about to reverse course, comes from years of trading. But we can also supplement that intuition with certain technical indicators to help confirm our gut feeling.
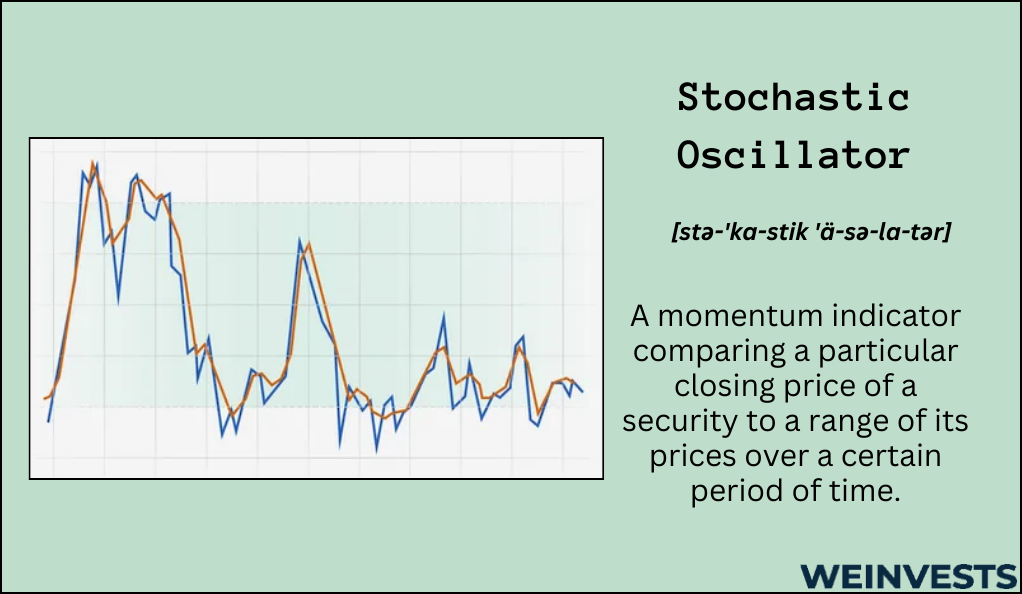
The class of indicators we’re talking about are called “momentum indicators,” and they’re designed to provide traders information about the strength of an asset’s current trend.
Today, we’re going to focus on one momentum indicator in particular: the stochastic oscillator.
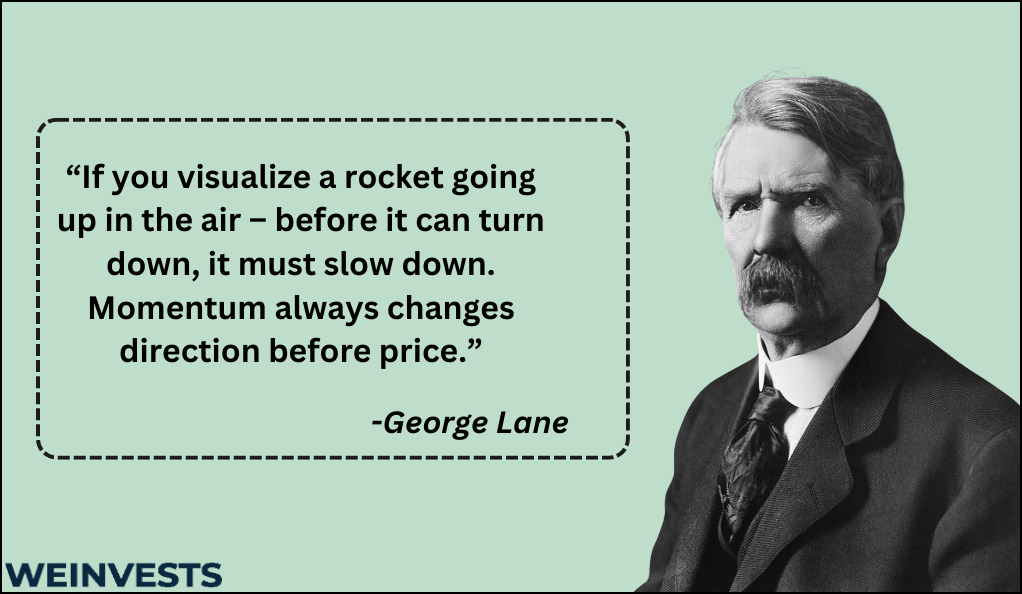
The stochastic oscillator was developed in the late 1950s by technician George Lane. A famous quote by George captures the value of understanding momentum: “If you visualize a rocket going up in the air – before it can turn down, it must slow down. Momentum always changes direction before price.”
So, by understanding momentum, we can try and predict future price movements.
And while the stochastic oscillator might have an intimidating name, there’s actually an easy-to-understand intuition behind all the numbers we’ll see today.
Before we get there, though, we’ll need to dig into the stochastic oscillator equation to understand how this indicator is calculated.
Detailed Explanation
The stochastic oscillator is relatively simple to calculate, but there are a couple steps involved. Let’s look at the two equations we’ll need before breaking down what each term means.
- Primary Line: %K = 100 x [(Current Close – Lowest Low) / (Highest High – Lowest Low)]
- Signal Line: %D = 3-period simple moving average of %K
Not too bad, right? Here’s a breakdown of the two lines that make up the stochastic oscillator.
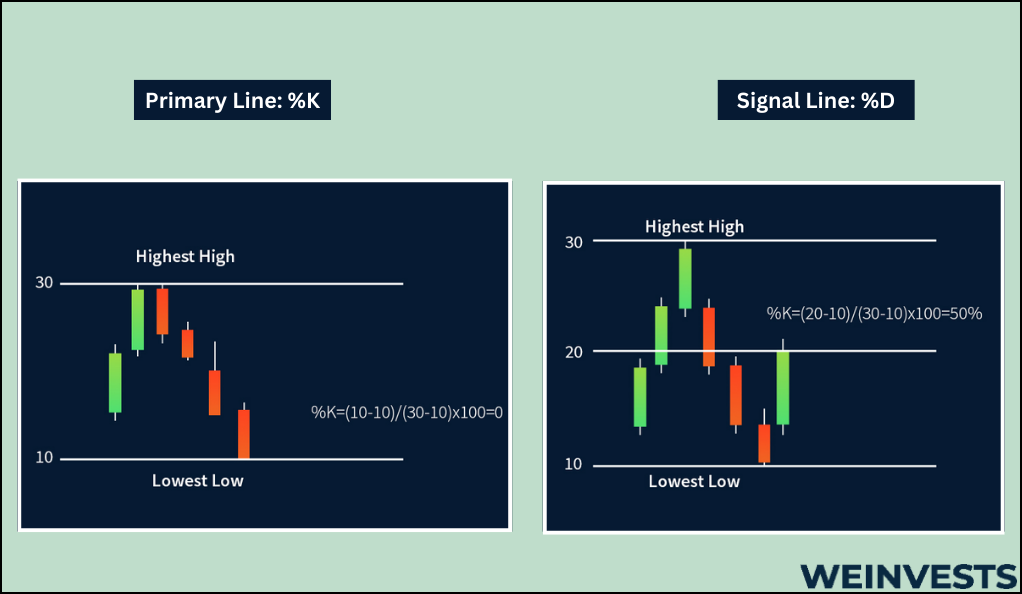
Primary line – %K
The primary line (or %K) is the one that reacts most immediately to new information. For that reason, it’s sometimes termed the ‘fast’ line.
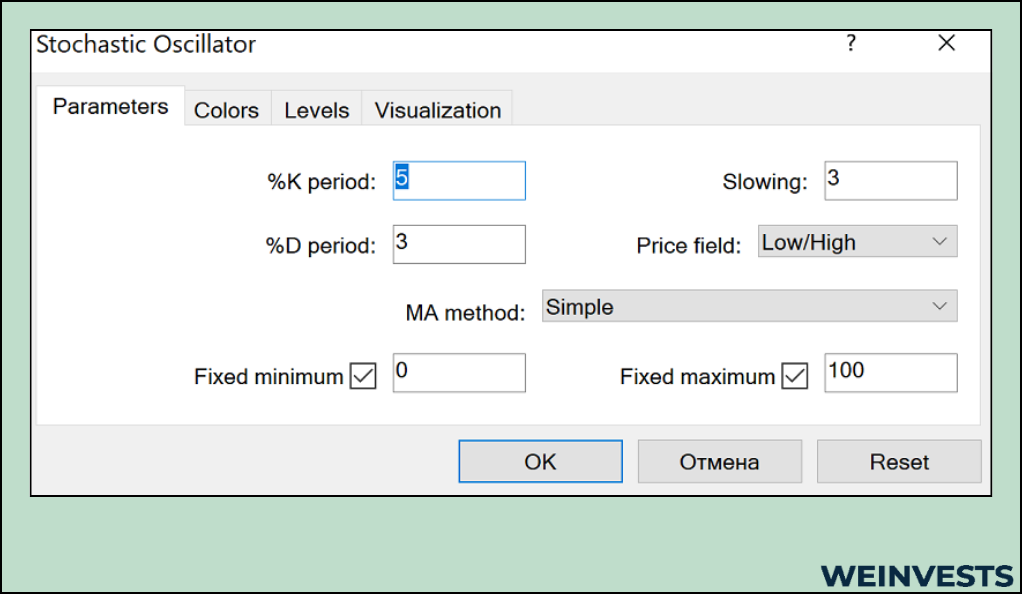
As you see in the equation, we’ll need to find the highest high and lowest low of a certain period. How long that period should be will probably depend on each individual trader – but a 14-day period is a very common choice.
The current close, of course, is the current day’s closing price. That’s updated every day, which is where the %K gets its fast reactivity from.
The highs and lows, meanwhile, may not update every day. If a stock hits a new 14-day low or high on a given day, then they could change. But it’s not guaranteed.
Now, %K has a fairly simple interpretation that’s not obvious at first glance. Basically, %K just shows how much closer we are to the high point than the low point, in percentage terms.
So, if the low is $5 and the high is $10 and the current close is $7.5, then %K would be 50%. If the close is the high, then %K is 100%. Meanwhile, if the close is the low, then %K is 0%.
Signal Line – %D
So, %K isn’t as intimidating as it might seem at first glance. The same is true of %D.
%D is just the simple moving average of %K. You can choose a number of different period values for %D, but a 3-day period is very common and effective.
%D basically just registers the average value of %K over the past few days. This helps smooth out any spikes in the primary line, which makes out signal interpretation more meaningful.
But it can also take longer to incorporate new information, which is why %D is sometimes called the ‘slow’ line.
%D and %K are plotted as two separate lines on a price chart. Understanding how to use these separate lines together, though, brings us to a couple key concepts you’ll need to understand to take full advantage of the stochastic oscillator.
Key Concepts
We’ll get to practical trading techniques with the stochastic oscillator in just a moment. First, though, we’ll need to cover some of the concepts behind the indicator in order to use it most effectively.
Momentum
Momentum is the strength of an asset’s price trend.
Not all trends are created equal. Even though two assets may be climbing in a similar fashion, one may have a lot of momentum behind its trend, and the other very little.
The first asset has a trend with strong momentum, meaning we expect it to carry on in a similar fashion. The second is likely prone to a quick reversal.
As George’s quote from earlier in the article captures, momentum is expected to change before trend does. With the stochastic oscillator, we want to identify current momentum.
The way to do so is by interpreting the stochastic oscillator in terms of selling conditions.
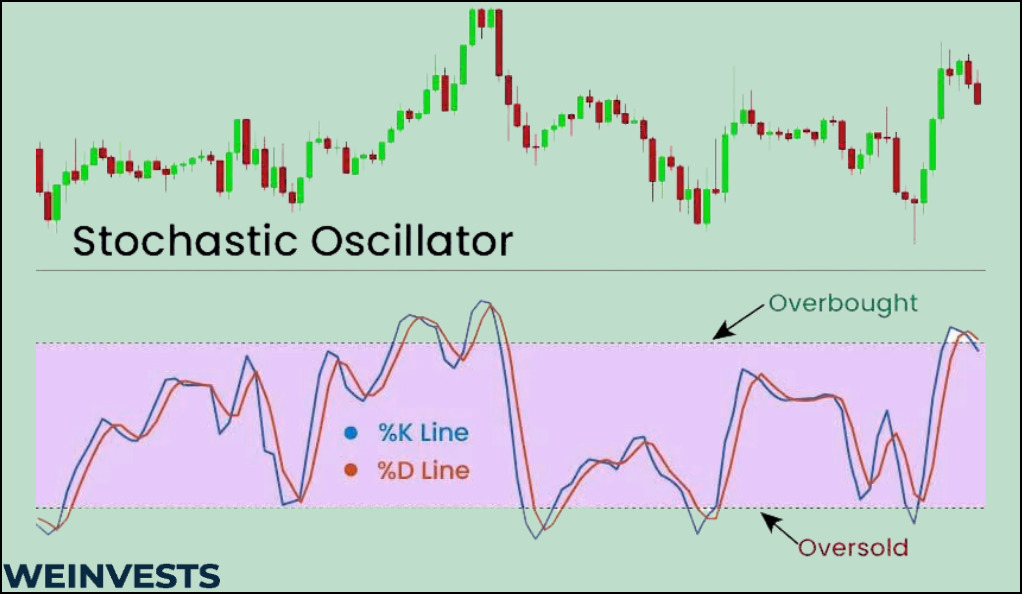
Overbought/Oversold
Earlier, we showed how to calculate the stochastic oscillator and explained a simple interpretation of it.
But without some broader context, those calculations just yield a figure without meaning.
The context we need is the ideas of overbought and oversold assets. The names of these terms capture the essence behind the concepts – some assets are overbought, which means their price has been pushed up too much. Others are oversold, which means their price has been pushed down too much.
If an asset is overbought or oversold, that means the price has changed more than the market would likely justify. As such, these assets are probably due for a reversal, as they are probably close to exhausting such strong momentum.
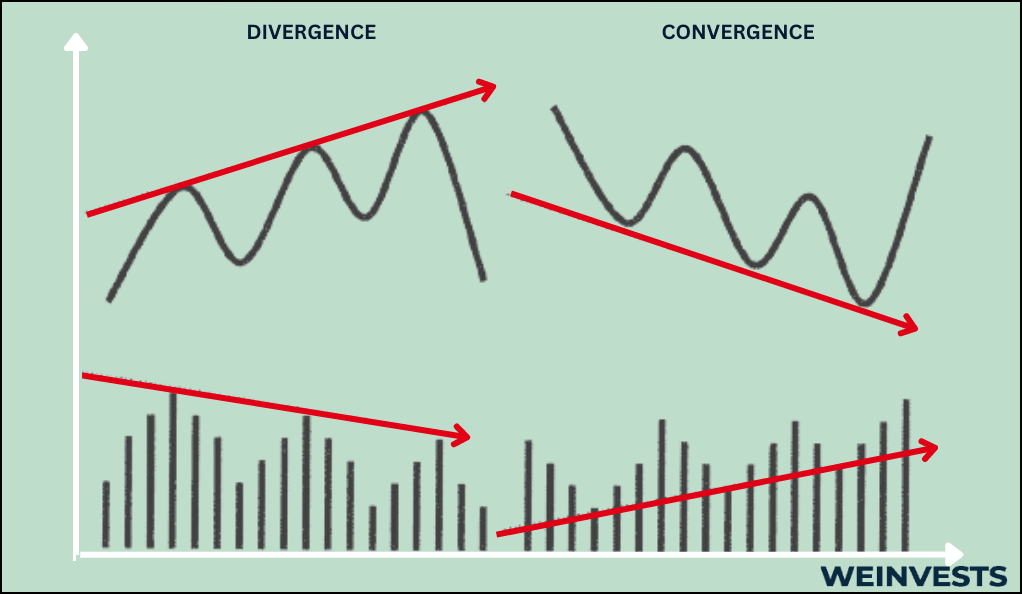
Convergence/Divergence
Finally, we have the concepts of convergence and divergence, which relate to understanding lines on a chart.
If two lines are moving in the opposite direction, they are said to be in divergence. If they are moving in the same direction, they are in convergence.
In the context of the stochastic oscillator, there are three basic lines to pay attention to in terms of convergence/divergence trends: the price line, %K, and %D.
The convergence or divergence of certain lines can be used to inform our trading. To understand how let’s turn to some of the practical trading strategies that the stochastic oscillator can be used for.
Trading Strategies
Ultimately, there are a wealth of trading strategies that the stochastic oscillator can play a core or supplemental role in. And unfortunately, we don’t have the space to cover them all in-depth.
But we’ll give you a few ideas here that you can study in more depth to find the trading strategy that’s right for you.
Using the stochastic oscillator to determine overbought/oversold positions
One of the most common uses of the stochastic oscillator is to supplement an existing trend following strategy.
Let’s say you’ve identified a trending asset, perhaps with the use of trendlines. If you’ve entered a trade, you’ll want to know when the trend might reverse so you can exit your position.
The stochastic oscillator can indicate overbought and oversold assets. Typically, levels of 80 and 20 are used as overbought and oversold levels for the %K indicator, respectively.
The %D, being a slower, less reactive line, can help confirm the %K signals.
If an asset is overbought or oversold, that likely means it has strong momentum. And momentum doesn’t last forever. So, we might expect this strong momentum to reach its peak and fade, giving way to a trend reversal.
That’s precisely why traders use the stochastic oscillator to determine when a trend could be reversing, letting them secure their profits by exiting their position.
Using divergence to confirm potential momentum changes
We can use some extra features of the stochastic oscillator to try and confirm incoming momentum shifts.
When the price line and the oscillator are diverging, that could be a sign that we need to pay attention to sudden changes. Note that by ‘oscillator’ we could be referring to the %K line, the %D line, or, most commonly, both.
The whole idea behind the stochastic oscillator is that short-term jumps or declines in price could indicate unjustified momentum. So, it’s no surprise that when the price is hitting new highs, but the oscillator lines aren’t coming along for the ride, investors should be wary about that trend falling apart.
Potential Risks
The stochastic oscillator is a very popular technical indicator, and we’ve provided a couple sound trading strategies that leverage its use. But these strategies are not without risk.
Let’s review some of the potential pitfalls you’ll need to be aware of to use the stochastic oscillator in practice.
False signals
Like other technical indicators, the signals given off by the stochastic oscillator aren’t foolproof. It’s entirely possible that what seems like a clear sign of a momentum change is a false signal.
Ultimately, it’s not possible to avoid the presence of false signals in our technical trading strategies. What we can do, though, is incorporate sound risk management into our trades to ensure that false signals don’t ruin our P&L.
Setting dependence
The stochastic oscillator can be customized to a certain extent by adjusting its settings.
The right settings will depend on the market you’re trading in and your personal trading style. It will likely take some experimentation to find which ones are right for you.
A 14-day lookback, a 3-day average, and 80/20 levels as indicating overbought/oversold conditions are the most common. They are therefore a good starting point. But that doesn’t mean they should be taken as an ending point.
Price sensitivity
The stochastic oscillator is more sensitive than most to big price jumps or falls. That’s because highs and lows are directly incorporated into the core calculations of the indicator.
Sometimes, especially in illiquid markets, such big price jumps aren’t reliable. For instance, suppose someone entered a trade mistakenly and purchased a stock for 20% higher than its current trading price.
Obviously, that’s not a good trade for them – but it will also mess up our stochastic oscillator strategy by registering an unreliable high price.
For that reason, cleaning up price data may sometimes be necessary to reliably use the stochastic oscillator.
Conclusion
Such risks remind us that the stochastic oscillator is an incomplete trading strategy on its own.
And that’s not surprising. While this indicator can give us very powerful information as to certain trends with respect to an asset’s momentum, it can’t really help us identify the underlying trends that momentum is powering.
Moreover, momentum may not even exist in certain markets. If an asset is “trading sideways,” it may not be rising or falling at all. Instead, it could just be bouncing around between a range in a choppy market.
And yet, the sensitivity of the stochastic oscillator might be throwing off unreliable momentum signals in such a market.
That’s why it’s so critical to pair the stochastic oscillator with other forms of technical indicators to form a comprehensive and profitable trading strategy.
By using multiple sources of information, along with practical trading experience, you can form a cohesive approach that doesn’t rely on just one indicator – even one as powerful as the stochastic oscillator.
FAQs
How to read stochastic oscillator?
The stochastic oscillator can be a bit tricky to interpret at first. Basically, the indicator shows us how much closer the current price is to the period high than the period low as a percentage. If the price is halfway between the high and low, the indicator would be 50. Typically, levels of 20 and 80 indicate oversold and overbought conditions, respectively.
Why stochastic oscillator works?
The stochastic oscillator can work, but you’ll need to find the proper settings on the indicator that aligns with your trading style. But overall, the stochastic oscillator works because it provides traders with information about the current momentum behind a trend. And, as anyone who has seen a ball thrown in the air slowly reverse course and fall back to earth, momentum always changes before trend does.
Best stochastic oscillator settings for day trading?
In truth, there’s no one set of settings that is optimal for the stochastic oscillator. The right choice will depend on your unique trading style. Therefore, you should experiment with the indicator to see which settings generate the most reliable signals. However, a 14-day lookback and a 3-day average are the most common settings to use when starting out.
WeInvests is a financial portal-based research agency. We do our utmost best to offer reliable and unbiased information about crypto, finance, trading and stocks. However, we do not offer financial advice and users should always carry out their own research.
Read More