Technical traders use a wide variety of indicators to analyze various assets and markets. Often, the number of tools available can get a little overwhelming.
That’s why it’s always useful to take advantage of indicators that incorporate multiple sources of information in one easy-to-understand format.
One series of indicators that falls in this category, which is enormously popular with technical traders, are Bollinger Bands.
Since their introduction by John Bollinger in the 1980s, Bollinger Bands have been iterated on many times, meaning there are a huge array of specific band structures out there.
But for the purposes of this article, we’ll be focusing on the fundamental information you need to know about Bollinger Bands to use them for effective market analysis.
Bollinger Bands are powerful for the way that they incorporate information not just about an asset’s trend, but also about its volatility. This can save traders a tremendous amount of time, as they don’t have to dig into an extra indicator for volatility figures.
Moreover, Bollinger Bands can be used in almost any market, making them particularly flexible for traders who trade a variety of assets.
Clearly, Bollinger Bands can be a powerful tool. But how do they actually work?
Detailed Explanation
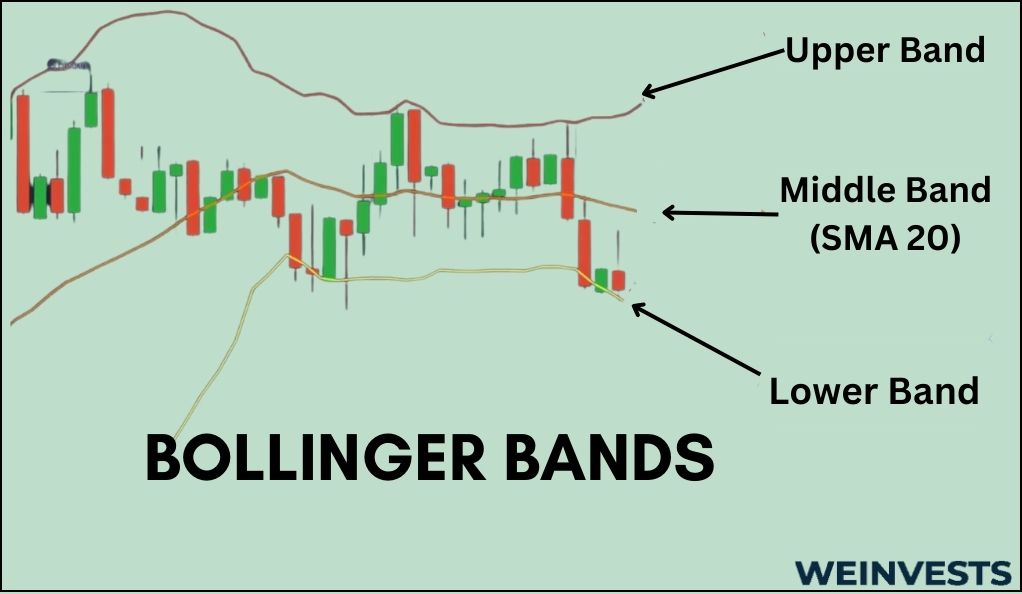
The basic Bollinger Band setup involves three lines which are drawn over a price chart. Appropriately enough for where the lines end up, they are known as the Upper, Middle, and Lower lines.
We’ll start by explaining the middle line – you’ll see why this is the best one to start with in a minute!
Middle line
The middle line is essentially just a moving average of the asset’s recent closing prices. More often than not, a simple moving average is used, which makes the calculation simple for traders.
In practice, the most commonly used moving average period is 20 days. So, to calculate the middle line, you would simply sum up the closing prices of the previous 20 days and divide them by 20.
As each successive day passes, the middle line will incorporate the new closing price, and drop the old one out of the equation. This makes it a somewhat slow indicator, generally meaning that changes are more meaningful than with ‘fast’ indicators.
Top and bottom line
What makes Bollinger Bands somewhat unique is that two of the lines in the indicator (the top and bottom) are almost entirely derived from the third line (the middle).
That’s because the top line and the bottom line are just scaled versions of the middle line.
The scaling factor is some multiple of the standard deviation of the closing prices over the same period that the simple moving average was calculated. So, if we’re using common settings, 20 days.
A common multiple to use when scaling the standard deviation is 2. So, to break it all down, the top line is set 2 standard deviations above the middle line, while the bottom line is set 2 standard deviations below the middle line.
Clearly, there’s a lot of information at play when using Bollinger Bands.
But don’t worry – understanding the mechanics behind Bollinger Bands just takes a little bit of practice. To get a clearer picture of what all this means, let’s dive into some of the key concepts at play.
Key Concepts
The preceding section captured much of what you’ll need to start understanding and using Bollinger Bands in practice. But it will be much easier to start experimenting with Bollinger Bands if you spend some time studying the key concepts listed here.
Standard deviation
Bollinger Bands make extensive use of standard deviation when calculating the position of the top line and bottom line. This is a term from statistics that might not be familiar to all traders.
Basically, standard deviation is just how far away each observation is from the mean on average. If this sounds familiar, that’s because it’s closely intertwined with volatility, which should be a familiar financial concept.
In fact, volatility is frequently measured by calculating the standard deviation of returns. So, although the terminology surrounding Bollinger Bands is more statistical, you probably already have the actual intuition behind many of the calculations.
Overbought and oversold conditions
The concepts of an asset being overbought and oversold might be familiar if you’ve studied indicators like the stochastic oscillator.
But the general idea is that the trend of an asset has a certain momentum behind it. And that momentum usually fades after its strongest showing – as the old saying goes, the candle that burns twice as bright lasts half as long.
So, if an asset has dropped more than the fundamentals justify, it may be oversold. This indicates strong momentum to the downside, which should soon reverse. Similarly, overbought conditions might indicate that an uptrend will fade.
Squeezes and expansion
The final concept may only be familiar if you’ve worked with volatility indicators before.
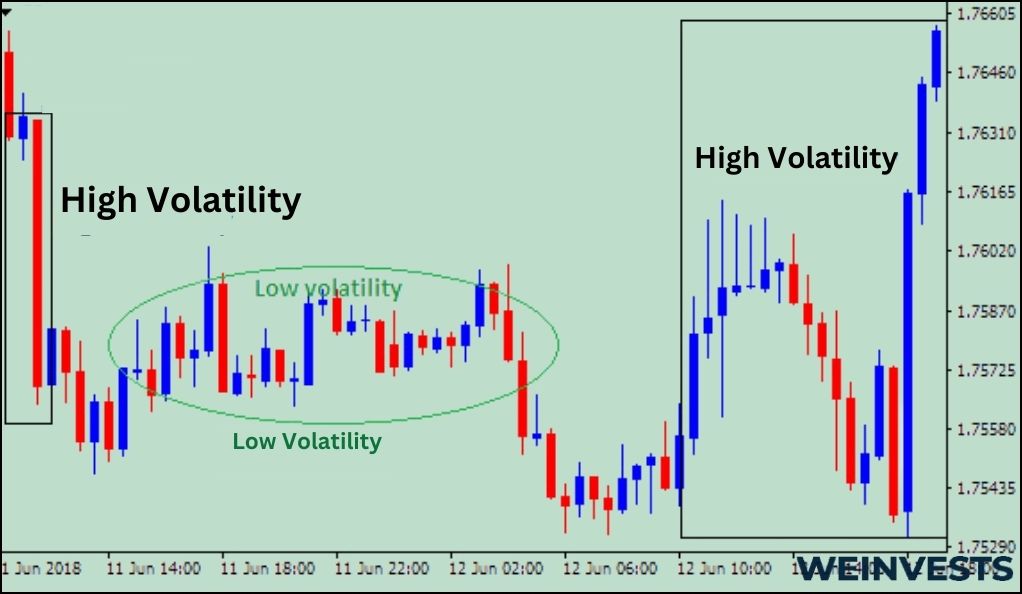
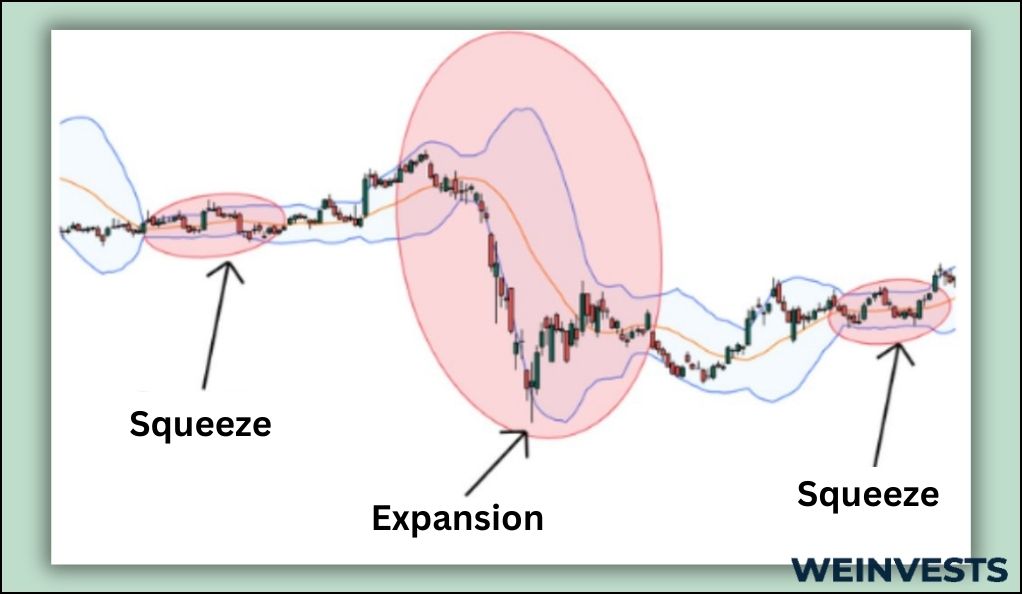
Squeezes and expansions are ways to describe recent volatility trends for an asset. A squeeze is a period of low volatility, while an expansion is a period of high volatility.
They are named as such because volatility bands based on moving averages tend to “squeeze” together when volatility declines. Of course, that also means they “expand” apart from each other when volatility increases.
Strategies and Techniques
Now that we’ve thoroughly covered the theoretical and intellectual framework for Bollinger Bands, it’s time to turn to the practical trading strategies you can use to analyze the market and turn a profit.
Despite the power of Bollinger Bands, which combine both trend and volatility information into a single indicator, it’s wise to use other forms of technical analysis to supplement your Bands.
Using multiple indicators can help confirm trends that really exist and add useful information outside the scope of trend and volatility.
With that caveat out of the way, the first trading strategy we’ll look at is the famous “Bollinger Bounce.”
Bollinger Bounce
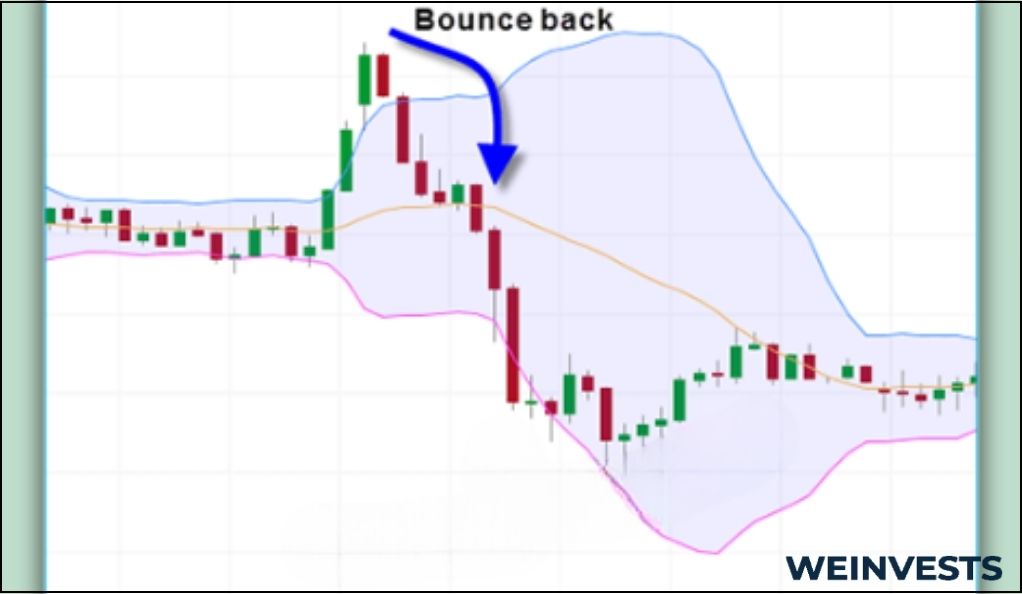
The Bollinger Bounce is the frequently observed phenomenon in which an asset’s price reverses trend after “bouncing” against the top line or bottom line of the Bollinger Bands.
This is closely connected with the overbought and oversold conditions we discussed as part of the Bollinger Bands key concepts.
When an asset’s price rises close to the top line, it is nearing the extreme level of its recent volatility (remember, standard deviation and volatility are essentially synonymous in finance).
This likely indicates an unsustainable uptrend. As such, the momentum will likely fade on the overbought asset. So, when the price hits the top line (or shortly after) the asset will likely fall back toward the middle line.
Similarly, if the price hits the bottom line, it will likely bounce up. Either of these trends can be profited from by going short or long, respectively.
Squeeze trading
As we discussed in the key concepts section, a squeeze means that the asset has entered a low volatility period. This can often occur at the end of a trend and indicates the market is consolidating.
As such, it can be a powerful time for a new volatility breakout and a trend to occur. Deciding which direction that trend will be, however, is the tough part.
If the middle line has been increasing or decreasing, it might be a sign that the opposite trend is about to occur. The reason why is that volatility tends to fade when momentum does, which can mean a trend is failing.
However, this example shows why Bollinger Bands are best supplemented with other indicators. While squeeze trading can be profitable, extra forms of technical analysis are likely necessary to identify which way a squeeze will end up playing out.
Case Study
Let’s walk through a simple example to see how Bollinger Bands might be used in practice, particularly with a bounce trading strategy.
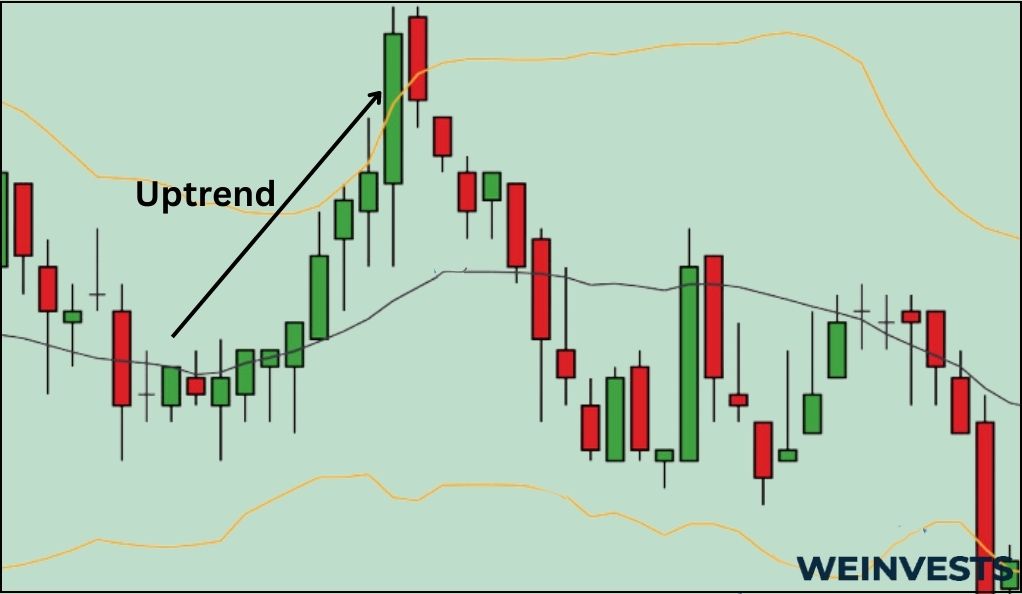
- Identify an attractive asset to trade. There are a lot of ways you can identify a good asset to trade, including visual identification of a trend on a chart or (more commonly) other technical analysis tools. Let’s say that the stock KO is in a bit of an uptrend.
- Set up Bollinger Band settings. Unless you’ve been using Bollinger Bands for a while, the best strategy is likely to stick with the most common settings. That would be a 20-day lookback period for the moving average and standard deviation calculations, as well as a 2-standard deviation range for your upper and lower bands.
- Chart the Bollinger Bands. While you can try doing this by hand, it’s a laborious and tedious process. Luckily, most technical trading software will calculate Bollinger Bands for you automatically.
- Wait for a bounce to use as an entry. Let’s say KO has been on its uptrend for a little while now and is moving farther above the middle line. Eventually, it hits the upper line, at which point it starts to retrace its previous movements. This could be an attractive opportunity to look for a potential reversal entry.
- Confirm entry with other indicators. Of course, we don’t want to just rely on one indicator to risk our capital on. In this case, look for another indicator that captures momentum information, like the MACD. This can help confirm that the trend is really reversing.
- Enter position. In this case, since we expect the trend to reverse and KO to begin falling, we would take a short position. The most common way to do this is by selling the stock short.
- Monitor the position for any changes. Once we’ve entered our trade, we’re only partly done. You’ll need to monitor the market and analyze the chart with your Bollinger Bands to know when to exit the position. For some traders, this could be merely when KO hits its middle line again – but more aggressive traders may wait until KO hits the bottom line.
Potential Risks
While Bollinger Bands may seem very powerful, it’s important to keep their limitations in mind when using them. Let’s review some of the potential risks of using this indicator.
Assumes normal distribution
Perhaps the biggest drawback of Bollinger Bands is that using them assumes asset values follow a normal distribution. While this assumption might work fine in financial markets most of the time, the few times an asset experiences an extreme jump in value can significantly affect a trader’s P&L.
Complicated volatility dynamics
While Bollinger Band analysis tends to condense the study of squeezes and expansions into indicating that a trend is reversing, ending, or beginning, volatility is a complicated subject. Traders should be aware that Bollinger Band analysis shouldn’t be your only source of information about volatility trends.
False bounces
Finally, like with other technical indicators, Bollinger Bands can be subject to false signals. In particular, false bounces are somewhat common. For instance, a price might touch an upper band, only to continue rising past it.
Conclusion
Clearly, Bollinger Bands are not a flawless tool. But their ability to combine both trend and volatility information in an easy-to-interpret format is extremely valuable.
This makes them a powerful tool in any trader’s arsenal and well worth your time to study. Just ensure you bear in mind the potential shortcomings of Bollinger Bands and how other indicators can best complement them.
FAQs
What do Bollinger Bands show?
Bollinger Bands are a set of three lines that each show something different. The middle line is the simple moving average of a certain lookup period of the closing price of the asset. The top and bottom lines, meanwhile, represent historical volatility levels that the asset rarely exceeds.
Best Bollinger Band settings?
The best settings for you will ultimately depend on your own unique trading strategy and style. However, the most common settings are a 20-day lookback period and a 2x standard deviation multiple. This is a great place to start experimenting.
What is the purpose of Bollinger Bands?
Bollinger Bands are a trading tool that can show how an asset’s recent trend relates to its recent volatility limits. This is a relatively unique way to combine trend and volatility information in a format that’s easy to quickly understand when making trading decisions.
WeInvests is a financial portal-based research agency. We do our utmost best to offer reliable and unbiased information about crypto, finance, trading and stocks. However, we do not offer financial advice and users should always carry out their own research.
Read More