Bollinger Bands are a widely used technical analysis tool in the world of trading and investing. Created by John Bollinger in the early 1980s, these bands provide valuable insights into price volatility, trends, and potential reversals.
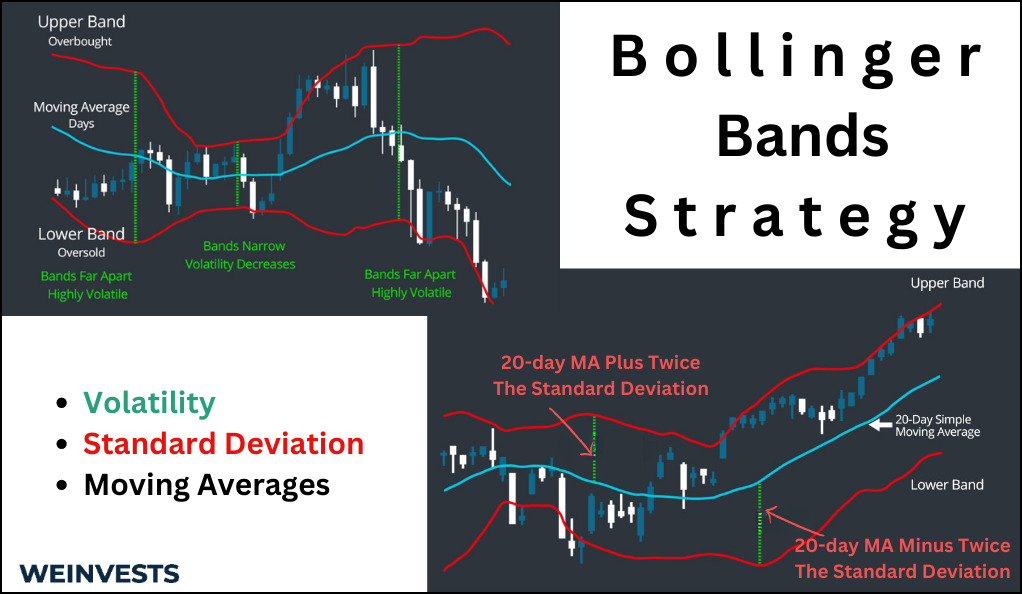
Bollinger Bands consist of three main components: the middle band, which is a simple moving average (SMA), and the upper and lower bands, which are derived from standard deviations. These bands are plotted on price charts, creating a dynamic envelope around the price action
The significance of Bollinger Bands lies in their ability to adapt to market conditions: they expand and contract based on price volatility, making them valuable for both identifying potential trading opportunities and managing risk. Traders and investors use Bollinger Bands to:
- Gauge the volatility of an asset;
- Identify potential entry and exit points;
- Detect trend changes and reversals.
- Determine overbought and oversold conditions
The purpose of this comprehensive guide is to give traders and investors the knowledge and skills needed to effectively utilize this tool: this article will take you on a journey through the fundamentals, interpretation, practical application, and advanced techniques associated with Bollinger Bands.
Understanding Bollinger Bands
Components of Bollinger Bands
At the heart of the Bollinger Bands is the middle band, which is a simple moving average (SMA). The SMA is a trend-following indicator that smoothens out price data over a specified period. In the context of Bollinger Bands, the middle band represents the average price of the asset over the chosen time frame.
It is derived by adding a specified number of standard deviations (typically 2) to the middle band’s value. This band serves as the upper limit of price movement and often acts as resistance during uptrends.
It is created by subtracting the same number of standard deviations from the middle band’s value. This band forms the lower boundary of price movement and often acts as support during downtrends.
To calculate Bollinger Bands, you’ll need three main components: the middle band (SMA), the upper band, and the lower band. The calculations involve the following steps:
- Calculate the SMA for a specified period (e.g., 20 periods).
- Calculate the standard deviation of the price data over the same period.
- Multiply the standard deviation by a specified factor (typically 2) to determine the distance between the upper and lower bands.
- Add the standard deviation value to the SMA to calculate the upper band.
- Subtract the standard deviation value from the SMA to calculate the lower band.
Bollinger Bands are visually represented on price charts as three lines which move in tandem with price fluctuations, creating a dynamic envelope around the price action.
Theoretical Foundations of the Bollinger Bands Strategy
The Bollinger Bands strategy is built upon several fundamental concepts that traders need to grasp for effective implementation.
- Volatility is a measure of an asset’s price fluctuations over time. In the context of Bollinger Bands, it is the key to understanding how the bands expand and contract. High volatility leads to wider bands, while low volatility results in narrower bands. Traders use this information to gauge potential price breakouts or reversals;
- Standard deviation is a statistical measure that quantifies the degree of variation or dispersion in a set of data. In Bollinger Bands, it is employed to calculate the distance between the upper and lower bands. A larger standard deviation results in wider bands, indicating greater price volatility, while a smaller standard deviation leads to narrower bands, suggesting lower volatility.
- Moving averages smooth out price data to create a single flowing line on a chart, providing a clearer view of a trend’s direction. The middle band of Bollinger Bands is a simple moving average (SMA) that serves as the reference point for assessing an asset’s trend. Traders often use SMAs of different time frames to capture short-term and long-term trends.
Interpreting Bollinger Bands
Interpreting Bollinger Bands is a skill that traders and investors develop over time. It involves recognizing patterns and signals that can inform trading decisions.
Bollinger Bands offer several key insights:
- Bollinger Band Squeeze: when the bands narrow significantly, it’s referred to as a Bollinger Band Squeeze. This indicates a period of low volatility and suggests that a significant price movement may be imminent. Traders often prepare for potential breakouts during these squeeze phases;
- Riding the Bands: One common approach is to buy when the price touches or crosses the lower band and sell when it reaches the upper band. This is known as riding the bands and is used to capitalize on price reverting to the mean. However, it’s essential to consider other indicators and market context before entering a trade;
- Divergence between price and Bollinger Bands can signal potential reversals. For example, if the price makes a new high while the upper band doesn’t, it could indicate weakening bullish momentum. Conversely, when the price makes a new low while the lower band doesn’t, it might suggest weakening bearish momentum;
- Price-Volume Relationships: analyzing the relationship between price and volume within the Bollinger Bands can provide further insights. For instance, if prices are touching the upper band with low volume, it may suggest a potential overbought condition, while prices nearing the lower band with high volume could indicate oversold conditions.
Practical Application of Bollinger Bands
Applying the Bollinger Bands strategy involves using the insights gained from interpreting the bands to make informed trading decisions.
- Using Bands for Market Entry: Traders often consider buying when the price touches or crosses the lower Bollinger Band, signaling potential oversold conditions, or selling when the price reaches or crosses the upper band, indicating potential overbought conditions. These are potential entry points, but it’s crucial to consider other indicators and market context before making a trade.
- Combining Bollinger Bands with Other Indicators: To increase the accuracy of entry signals, many traders combine Bollinger Bands with other technical indicators like the Relative Strength Index (RSI) or Moving Average Convergence Divergence (MACD). These combinations provide a more comprehensive view of market conditions;
- Setting Stop-Loss and Take-Profit Orders: Risk management is a fundamental aspect of trading. When using the Bollinger Bands strategy, traders often set stop-loss orders just outside the bands to limit potential losses. Additionally, they can establish take-profit orders when the price approaches the opposite band to secure profits;
- Position Sizing and Risk Management: Position sizing is the process of determining the number of units or contracts to trade based on your risk tolerance and the distance between your entry point and stop-loss. Effective position sizing is essential for preserving capital and managing risk. Traders using Bollinger Bands should calculate their position size to ensure they don’t risk more than a predetermined percentage of their trading capital on a single trade.
Backtesting and Strategy Development
Developing a successful trading strategy based on Bollinger Bands requires thorough analysis and testing.
Historical data is the foundation of strategy development. Traders use historical price and volume data to backtest their strategies, simulating how they would have performed in past market conditions. This step helps refine and optimize the strategy before deploying it in real-time.
Traders construct trading strategies by defining entry and exit rules, stop-loss and take-profit levels, and position sizing parameters. These strategies are then tested on historical data to evaluate their performance, including profitability and risk.
Markets evolve, and strategies that work in one environment may not perform as well in another. Traders should be prepared to fine-tune their Bollinger Bands-based strategies to adapt to changing market conditions. This adaptability is a key advantage of the strategy.
In the following sections, we’ll explore common mistakes to avoid and provide real-world examples to illustrate the Bollinger Bands strategy in action.
Common Mistakes to Avoid
While the Bollinger Bands strategy can be a powerful tool, traders often make common errors that can undermine its effectiveness. Here are some pitfalls to be aware of:
- Over Reliance on Bollinger Bands Alone: Relying solely on Bollinger Bands without considering other indicators or market factors can lead to false signals and losses;
- Ignoring Risk Management: Failing to set appropriate stop-loss orders, position sizes, and take-profit levels can expose traders to excessive risk. It’s essential to protect capital;
- Neglecting the Broader Market Context: Bollinger Bands are most effective when used in conjunction with a broader market analysis. Ignoring economic events, news, and market sentiment can lead to poor decision-making.
Real-World Examples
To gain a deeper understanding of how the Bollinger Bands strategy works in practice, let’s explore some real-world examples:
Case Study 1: Swing Trading with Bollinger Bands
Scenario: A swing trader is looking to capitalize on short to medium-term price movements in a stock.
Strategy: The trader uses Bollinger Bands to identify potential entry and exit points. They set a 20-period simple moving average (SMA) as the middle band, with 2 standard deviations for the upper and lower bands. They watch for Bollinger Band squeezes, indicating low volatility, as potential entry points. When a squeeze occurs, they place a buy order slightly above the upper band and set a stop-loss order just below the middle band. As the price moves towards the upper band, they adjust their stop-loss to lock in profits.
Result: Over a few months, the trader identifies multiple swing trading opportunities using Bollinger Bands. They successfully ride price fluctuations within the bands and exit trades with profits during periods of volatility expansion. The strategy yields consistent gains, making it a valuable tool for the swing trader.
Case Study 2: Intraday Trading Strategies
Scenario: An intraday trader seeks to profit from short-term price movements during a single trading session.
Strategy: The trader employs a 5-minute chart with Bollinger Bands (20-period SMA with 2 standard deviations). They focus on quick scalping opportunities by entering trades when the price touches the upper or lower band. When the price approaches the upper band, they short the asset, aiming for a quick profit as it reverts to the mean (middle band). Conversely, when the price touches the lower band, they go long, anticipating a bounce back towards the middle band. Strict stop-loss and take-profit orders are set for each trade.
Result: This intraday trading strategy proves effective for capturing short-term price movements. The trader executes multiple trades in a single day, capitalizing on the frequent price reversals within the Bollinger Bands. By adhering to strict risk management, they achieve consistent profitability in intraday trading.
Case Study 3: Bollinger Bands in Long-Term Investing
Scenario: A long-term investor aims to make informed entry and exit decisions for a portfolio of stocks.
Strategy: The investor combines fundamental analysis with Bollinger Bands to optimize their long-term investment strategy. They use a weekly chart with Bollinger Bands (20-week SMA with 2 standard deviations) to assess the overall market conditions. When the price of a stock they’re interested in approaches the lower band on the weekly chart, indicating potential oversold conditions, they initiate a position. They use the Bollinger Bands as a confirmation tool alongside their fundamental analysis, such as earnings reports and industry trends.
Result: The investor’s approach combines the strengths of fundamental analysis with technical insights from Bollinger Bands. By using Bollinger Bands as an additional filter for long-term investment decisions, they enter positions at favorable points in the market cycle. Over time, their portfolio sees improved performance, and they successfully navigate various market conditions.
Advanced Techniques and Variations
While the basic Bollinger Bands strategy is effective, traders often develop advanced techniques and variations to enhance their trading edge. Here are some advanced concepts:
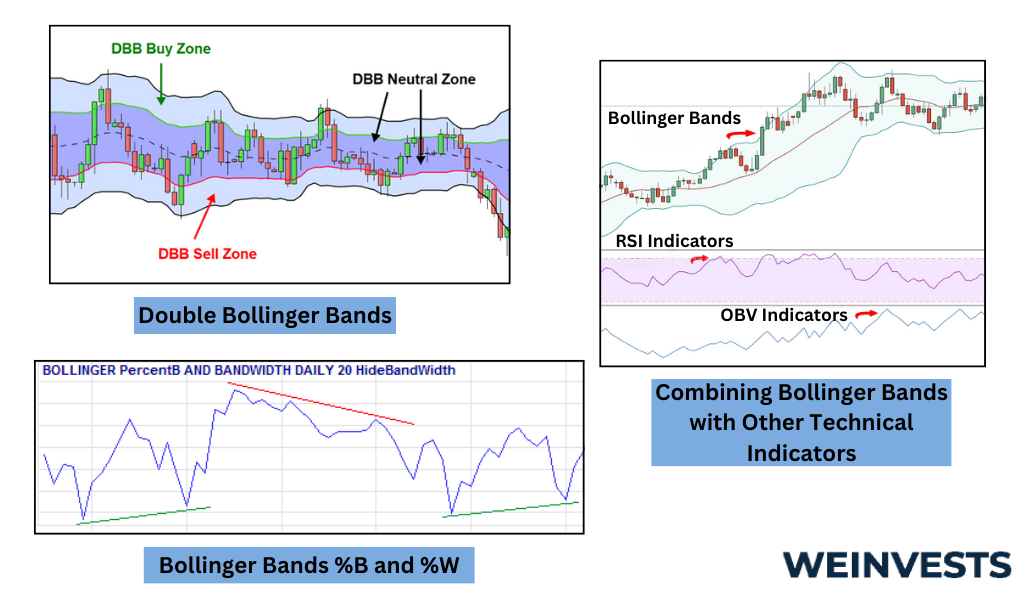
- Double Bollinger Bands: This technique involves adding a second set of Bollinger Bands with different parameters to the chart. It provides additional layers of support and resistance.
- Bollinger Bands %B and %W: %B measures where the current price is in relation to the Bollinger Bands, while %W indicates the width between the bands. These metrics help traders assess overbought and oversold conditions and volatility.
- Combining Bollinger Bands with Other Technical Indicators: Traders frequently combine Bollinger Bands with oscillators, trend-following indicators, or candlestick patterns to create hybrid strategies with more precise entry and exit signals.
Trading Psychology and Discipline
Successful implementation of the Bollinger Bands strategy extends beyond technical analysis; it also involves mastering the psychological aspects of trading.
Trading can be emotionally challenging, especially when faced with losses or unexpected market movements. The volatility inherent in trading using Bollinger Bands can lead to stress, anxiety, and impulsive decision-making. Traders must learn to manage their emotions and maintain discipline.
One of the keys to success is sticking to a well-defined trading plan. A trading plan outlines entry and exit rules, risk management strategies, and goals. By adhering to the plan, traders reduce the likelihood of making impulsive decisions driven by fear or greed.
FAQs
What is the Bollinger Band Squeeze, and how can I profit from it?
A Bollinger Band Squeeze occurs when the bands narrow significantly, indicating a period of low volatility. Traders watch for squeeze patterns as they often precede significant price movements. To profit from a squeeze, traders may enter positions in anticipation of a breakout, setting stop-loss and take-profit levels to manage risk.
Are there any alternative indicators to use alongside Bollinger Bands?
Yes, traders often combine Bollinger Bands with other indicators to improve decision-making. Commonly paired indicators include the Relative Strength Index (RSI), Moving Average Convergence Divergence (MACD), and Stochastic Oscillator. Combining indicators can provide more robust trading signals.
Can I use Bollinger Bands for long-term investing?
While Bollinger Bands are often associated with short-term trading, they can also be used in long-term investing. For investors, the bands can help identify entry points for long-term positions and assess the overall market conditions. However, long-term investors should complement Bollinger Bands with fundamental analysis for a more comprehensive view.
WeInvests is a financial portal-based research agency. We do our utmost best to offer reliable and unbiased information about crypto, finance, trading and stocks. However, we do not offer financial advice and users should always carry out their own research.
Read More