Fibonacci retracements, often regarded as a mystical tool in the realm of financial markets, hold a unique allure for traders and investors alike. Their seemingly magical ability to predict price movements has made them an integral part of technical analysis.
But how do Fibonacci retracements work, and why are they so widely used? In this comprehensive guide, we will demystify the enigma of Fibonacci retracements: we will start by laying the foundation with a deep dive into the Fibonacci sequence, the mathematical marvel that forms the basis of this tool. From there, we will explore the Golden Ratio, a concept in nature and mathematics that intertwines with the Fibonacci sequence. Armed with this knowledge, we will delve into the mechanics of Fibonacci retracements, unravelling the logic behind their application in financial markets.
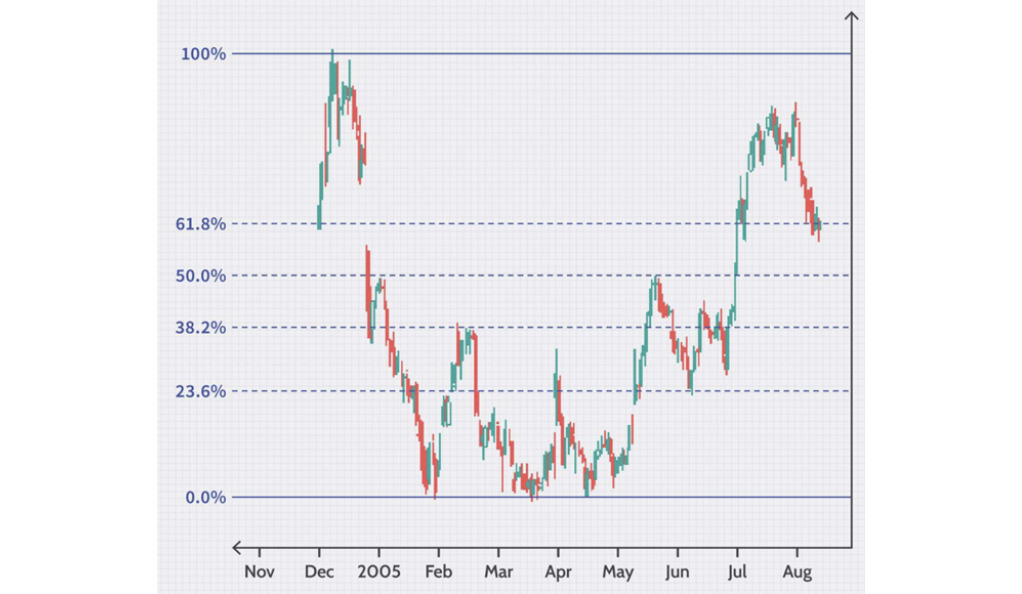
Table of Contents
- The Fibonacci Sequence: A Primer
- The Golden Ratio: Nature’s Blueprint
- Fibonacci Retracements Explained
- How to Calculate Fibonacci Retracements
- Fibonacci Retracements in Action
- Common Mistakes and Pitfalls
- Fibonacci Extensions: Taking It to the Next Level
- Combining Fibonacci with Other Technical Tools
- Practical Tips for Trading with Fibonacci Retracements
- FAQs
- What is the Fibonacci retracement tool in trading?
- How do I use Fibonacci retracement levels in my trading strategy?
- Can traders use Fibonacci retracement levels with other indicators?
- What is the Fibonacci extension tool and how can traders use it?
- How can I effectively apply Fibonacci extensions in trend trading?
- Are Fibonacci retracement and extension levels equally effective in different markets (stocks, forex, cryptocurrencies)?
- Conclusion
The Fibonacci Sequence: A Primer
The Fibonacci sequence, named after the Italian mathematician Leonardo of Pisa (known as Fibonacci), is a sequence of numbers that begins with 0 and 1, and each subsequent number is the sum of the two preceding ones. This results in the sequence: 0, 1, 1, 2, 3, 5, 8, 13, 21, 34, and so on. To derive the next number in the sequence, you simply add the last two numbers. This sequence, in itself, is intriguing, but its real power lies in its relationships and applications.
The Fibonacci sequence is a ubiquitous phenomenon in various natural phenomena, from the arrangement of leaves on a stem to the spirals of galaxies. This ubiquity is not a mere coincidence; it’s a reflection of a fundamental mathematical principle encoded in the fabric of the universe.
The Golden Ratio: Nature’s Blueprint
At the heart of the Fibonacci sequence lies a mysterious number known as the Golden Ratio, often denoted as Phi (Φ). This irrational number, approximately equal to 1.6180339887, is a mathematical constant that plays a pivotal role in many aspects of art, architecture, and nature. It’s the key to unlocking the magic of Fibonacci retracements.
The Golden Ratio’s connection to the Fibonacci sequence is simple yet profound. As you progress through the Fibonacci sequence, the ratio of consecutive numbers increasingly approximates Phi. For instance, as you divide 8 by 5, you get 1.6, a close approximation to Phi, and this approximation becomes more accurate as you move further along the sequence. This unique mathematical relationship forms the basis for understanding why Fibonacci retracements are so significant in financial markets.
In the next section, we’ll transition from the mathematical foundations to the practical applications of Fibonacci retracements, exploring how these concepts come together to influence traders’ decisions and market movements.
Fibonacci Retracements Explained
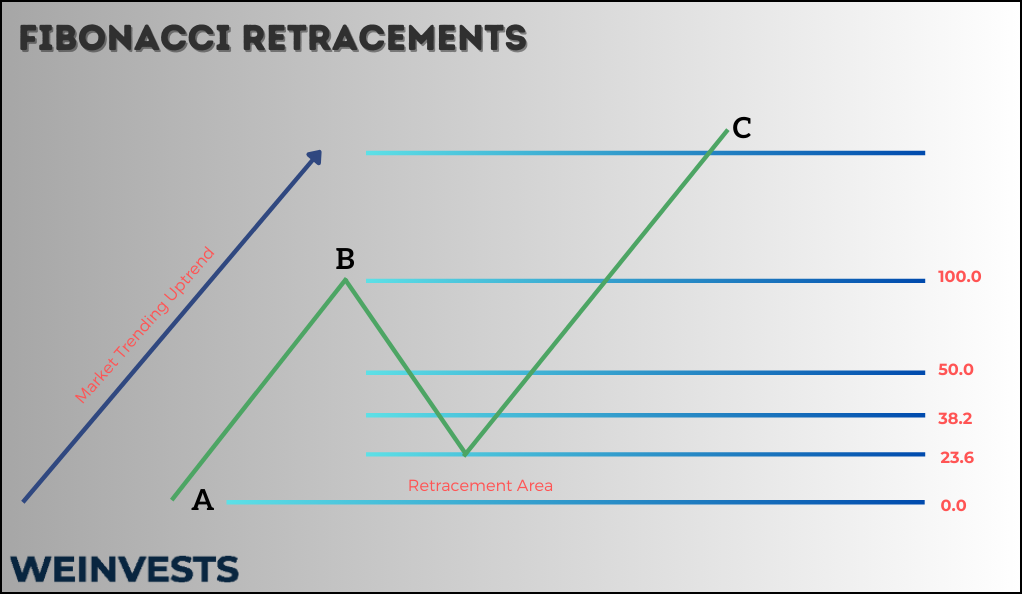
Fibonacci retracements are a critical tool in technical analysis for traders and investors. In trading, Fibonacci retracements help identify potential support and resistance levels by plotting horizontal lines at key percentages of a price’s recent move. These retracement levels, typically set at 23.6%, 38.2%, 50%, 61.8%, and 100%, are crucial in predicting price reversals or corrections.
The logic behind Fibonacci retracements is grounded in the idea that market movements often exhibit patterns related to the Fibonacci sequence. Traders believe that when a price trend retraces, it may pause or reverse at these specific Fibonacci levels due to the psychological behavior of market participants. For instance, a stock that has risen significantly may find support at the 38.2% or 61.8% retracement levels as traders take profits or re-enter positions.
A visual representation of a price chart with retracement levels shows these horizontal lines intersecting with the price action, highlighting potential areas of interest for traders. The closer the retracement level to 100%, the stronger the potential support or resistance.
How to Calculate Fibonacci Retracements
The mathematical formula for calculating Fibonacci retracement levels involves subtracting the difference between the high and low of a price move by a series of Fibonacci ratios (e.g., 23.6%, 38.2%, 50%, 61.8%) and adding these results to the low point of the move.
The formula is as follows:
Retracement Level = Low + (Retracement Percentage * (High – Low))
For example, if a stock’s low is $50 and the high is $70, the 38.2% retracement level would be calculated as:
38.2% Retracement = $50 + (0.382 * ($70 – $50)) = $58.20
Most modern trading platforms offer automated Fibonacci retracement tools, making it easy for traders to apply these levels to their charts. Users can select the starting and ending points of a price move, and the platform will plot the retracement levels automatically.
Fibonacci Retracements in Action
Real-life examples of financial charts illustrate the practical application of Fibonacci retracements. Traders use these retracement levels to identify potential areas of support during uptrends and resistance during downtrends. For instance, if a stock’s price rallies from $50 to $70 and then retraces, it may find support near the 38.2% or 61.8% retracement levels.
The psychology behind traders’ reactions to Fibonacci retracement levels is rooted in the idea of self-fulfilling prophecies. As many traders use these levels, they become important reference points in the market. When a retracement approaches a key Fibonacci level, traders are more likely to buy or sell, leading to price reversals or consolidations.
In summary, Fibonacci retracements are a powerful tool in technical analysis, providing traders with a systematic approach to identifying potential support and resistance levels. Their mathematical calculation and prevalence in trading platforms make them accessible to traders of all levels, while their use is bolstered by the psychological impact of these well-known levels in financial markets.
Common Mistakes and Pitfalls
- Misconceptions: One common misconception is that Fibonacci retracements are infallible and always result in predictable price movements. In reality, they are just one tool among many, and markets can be influenced by various factors;
- Blind Reliance: Blindly relying on Fibonacci retracement levels without considering other market fundamentals or indicators can be risky. Markets are complex, and no single tool provides all the answers;
- Incorrect Placement: Traders often make mistakes in identifying the correct swing points to apply Fibonacci retracements, leading to inaccurate levels and misguided trading decisions.
To use Fibonacci retracements effectively, traders should:
- Combine with Other Analysis: Use them in conjunction with other technical analysis tools to confirm signals and reduce reliance on Fibonacci alone.
- Consider Market Context: Evaluate broader market conditions, news events, and trends before making decisions solely based on retracement levels.
- Practice and Learn: Continuously practice and refine their understanding of Fibonacci retracements through real trading experiences.
Fibonacci Extensions: Taking It to the Next Level
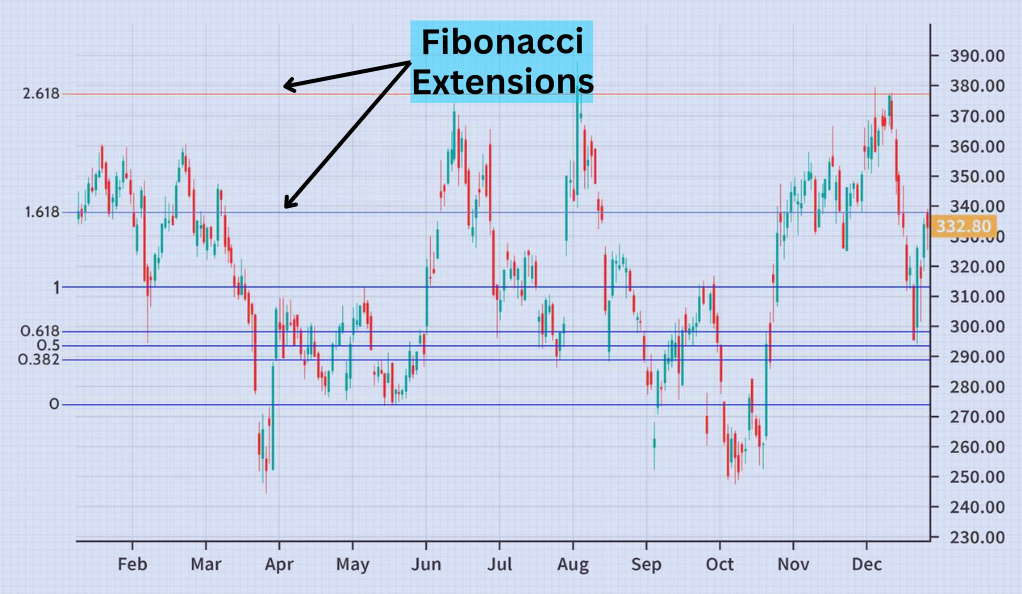
Fibonacci extensions are a natural extension of retracements. While retracement levels help identify potential reversal points, extensions help traders project potential price targets when a trend continues. Extensions use Fibonacci ratios like 161.8% and 261.8% to estimate where a price might move beyond its previous high or low.
For example, if a stock’s price retraces from $70 to $50 and then starts to rally again, traders can use Fibonacci extensions to project potential future resistance levels or profit-taking points, such as $85 (161.8% extension) or $105 (261.8% extension).
Combining Fibonacci with Other Technical Tools
Combining Fibonacci retracements with other technical tools enhances the depth and accuracy of analysis. Here are some benefits and examples of synergy:
- Trendlines: Traders can use trendlines to confirm Fibonacci retracement levels. When trendlines align with key Fibonacci levels, it strengthens the case for support or resistance at those points;
- Moving Averages: Combining Fibonacci retracements with moving averages can help traders identify potential reversal zones at the confluence of retracement levels and moving average lines;
- Oscillators: Oscillators like the Relative Strength Index (RSI) or Stochastic Oscillator can be used alongside Fibonacci retracements to identify overbought or oversold conditions. When these conditions coincide with Fibonacci levels, it can signal potential reversals.
Case studies demonstrating synergy might include instances where a stock price retraces to a key Fibonacci level, coinciding with a trendline and a confluence of moving averages. Traders can use this confluence to make more informed decisions about potential reversals or trend continuations.
Practical Tips for Trading with Fibonacci Retracements
- Plan Your Strategy: Before using Fibonacci retracements, define your trading strategy. Determine your entry and exit points, and decide how you will use Fibonacci levels to make informed decisions;
- Combine with Other Tools: Use Fibonacci retracements alongside other technical indicators, such as moving averages or oscillators, to confirm signals and reduce risk;
- Risk Management: Implement proper risk management techniques, like setting stop-loss orders, to protect your capital. Don’t risk more than you can afford to lose;
- Position Sizing: Adjust your position size based on the distance to the nearest Fibonacci level and your risk tolerance. Smaller positions near key levels can help manage risk;
- Timeframe Selection: Consider the timeframe that aligns with your trading style. Short-term traders may use lower timeframes, while long-term investors might prefer daily or weekly charts;
- Market Relevance: Be aware that Fibonacci retracements are applicable in various markets, including stocks, forex, and cryptocurrencies. Adapt your approach to the specific market you are trading.
FAQs
What is the Fibonacci retracement tool in trading?
The Fibonacci retracement tool is a technical analysis tool used to identify potential levels of support or resistance during a price retracement. Traders use Fibonacci levels (38.2%, 50%, 61.8%, etc.) to anticipate price reversals in a trending market.
How do I use Fibonacci retracement levels in my trading strategy?
To use Fibonacci retracement levels, identify a recent swing high and low in the price movement. Apply the Fibonacci retracement tool to plot potential support and resistance levels. Traders often look for price bounces or reversals near these levels as potential entry or exit points.
Can traders use Fibonacci retracement levels with other indicators?
Yes, Fibonacci retracement levels can be used in conjunction with other technical indicators like moving averages, RSI, or MACD to confirm trading signals. Combining these indicators with Fibonacci levels can provide a more comprehensive view of potential price movements.
What is the Fibonacci extension tool and how can traders use it?
The Fibonacci extension tool is used to identify potential price targets or areas of interest beyond the current price range. Traders use Fibonacci extension levels (e.g., 127.2%, 161.8%) to project where an asset’s price may reach after a significant price move, aiding in setting profit targets.
How can I effectively apply Fibonacci extensions in trend trading?
In trend trading, Fibonacci extensions help identify potential levels where a trend may continue or reverse. After identifying a strong trend, apply the Fibonacci extension tool to project potential price targets. Traders may consider scaling out of their positions as the price approaches these extension levels.
Are Fibonacci retracement and extension levels equally effective in different markets (stocks, forex, cryptocurrencies)?
Fibonacci retracement and extension levels can be effective across various markets, including stocks, forex, and cryptocurrencies. However, their effectiveness may vary based on market conditions and liquidity.
Conclusion
In conclusion, understanding Fibonacci retracements is a valuable skill for traders and investors. They offer insights into potential price levels, but they should be used alongside other tools and with a well-thought-out strategy.
Remember to manage risk, adapt to different markets, and continuously refine your approach. Start experimenting and gaining experience with Fibonacci retracements to unlock their magic in your trading journey.
WeInvests is a financial portal-based research agency. We do our utmost best to offer reliable and unbiased information about crypto, finance, trading and stocks. However, we do not offer financial advice and users should always carry out their own research.
Read More