If you’ve been trading for a while, you might have noticed an interesting pattern relating to stock prices.
It seems like when a stock goes up for an extended period of time, it hits several prices along the way at which it struggles to break through. When a stock goes into a downtrend, it might hit a couple of prices at which the stock bounces, before continuing to fall.
Sometimes, these points of contact even become full-blown reversals, causing a downtrend to become an uptrend and vice versa. This phenomenon is common enough that traders started to study it, eventually building what is known as the Fibonacci retracement system.
Fibonacci retracements are a way to automatically calculate the places a stock will likely encounter support or resistance on its path up or down. This method can advise traders as to the key areas they need to pay attention to when a stock price is changing.
While this strategy is named after a man named Fibonacci, he was not a trader at all. Instead, he was a mathematician from 12th-century Italy.
As it turns out, understanding why a trading strategy is named after a mathematician from the Middle Ages will help us understand the art of Fibonacci retracement.
Detailed Explanation
Fibonacci retracement is named after the Fibonacci numbers, a string of numbers popularized by Fibonacci the mathematician.
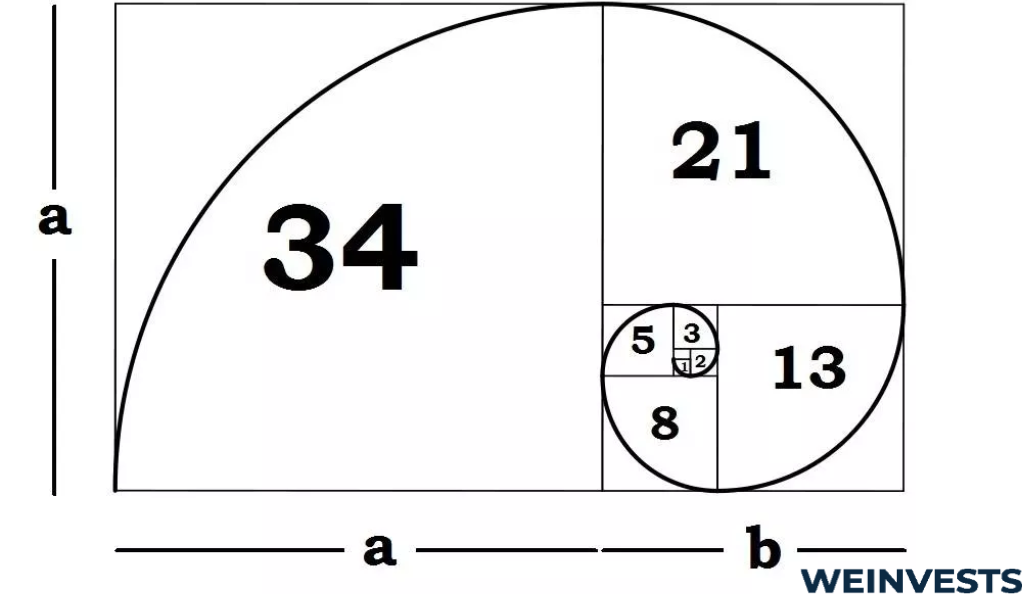
The Fibonacci sequence starts with 1 and then adds each number to the previous number. So, the sequence goes 1, 1, 2, 3, 5, 8, 13, 21, 34, and so on.
There are several special properties of the Fibonacci numbers that make them interesting to study from a mathematical perspective. For our purposes, the most important property is the ratio that is approached when each Fibonacci number is divided by its preceding number. This ratio is about 61.8%.
This figure is very closely related to the Golden ratio, being its inverse. The Golden ratio, and by extension the Fibonacci sequence, is very commonly observed in nature.
So, what does this all have to do with finance?
Simple reasoning shows that if the Golden ratio shows up in nature, it might show up in markets. After all, they are both complex systems with emergent properties and many different participants.
While this argument sounds nice, it happens to play out well in practice. The Golden ratio can be used to determine some of the most important areas of support and resistance when a stock price changes. Thus, the name Fibonacci retracement was born.
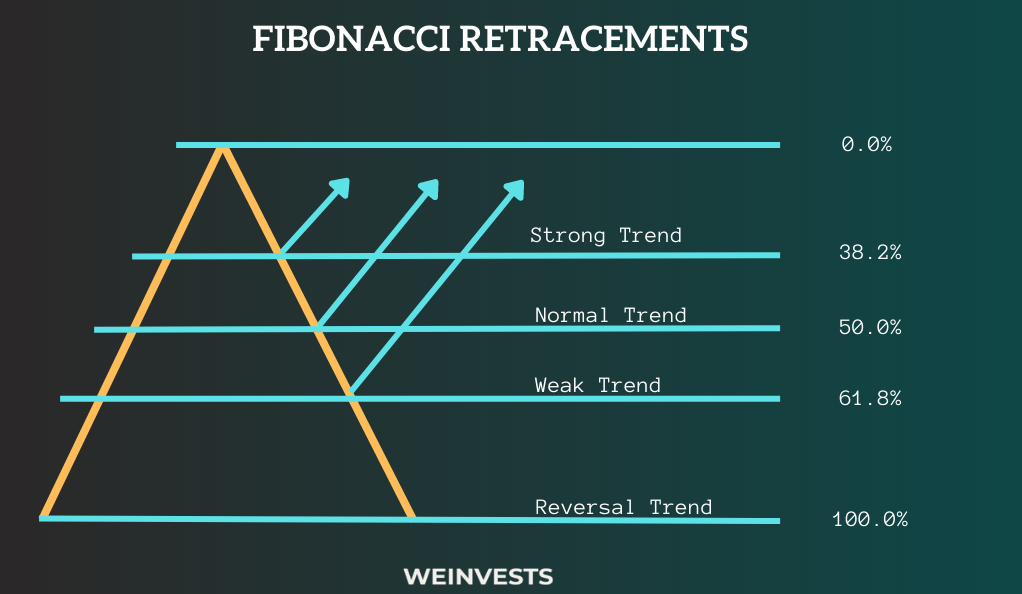
In practice, the percentage levels of 23.6%, 38.2%, 50%, and 61.8% are commonly used. Note that 38.2% is about 61.8% of 61.8, and 23.6% is about 61.8% of 38.2. The 50% level is not related to the Fibonacci sequence but is still popular.
Traders put these ratios to practice by identifying peaks and troughs in stock price movements and charting these key levels. In doing so, they identify the areas where a potential market reversal might occur.
Truly putting Fibonacci retracement to practice, though, requires understanding some key concepts.
Key Concepts
The explanation of Fibonacci numbers and the Golden ratio is useful, but not enough on its own. We’ll need to grasp some key technical trading concepts to use Fibonacci retracement effectively.
Retracement
Retracement describes the phenomenon discussed in the introduction. When a stock moves up significantly, it does not do so in a straight line. Instead, it will likely reverse its movement at several points. This behavior is known as retracement.
[“Graphic chart showing retracement”]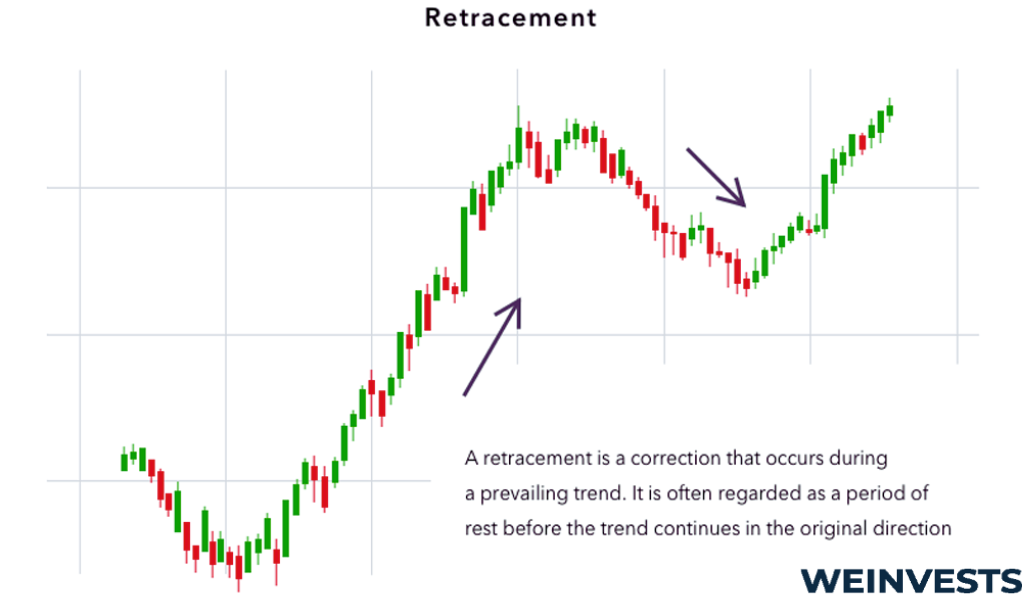
There are other theories of retracement aside from Fibonacci retracement. The general concept to understand, though, is that stocks don’t move in just one direction. This retracement behavior can either be overcome, in which case a stock will continue moving in its current direction, or signal a reversal.
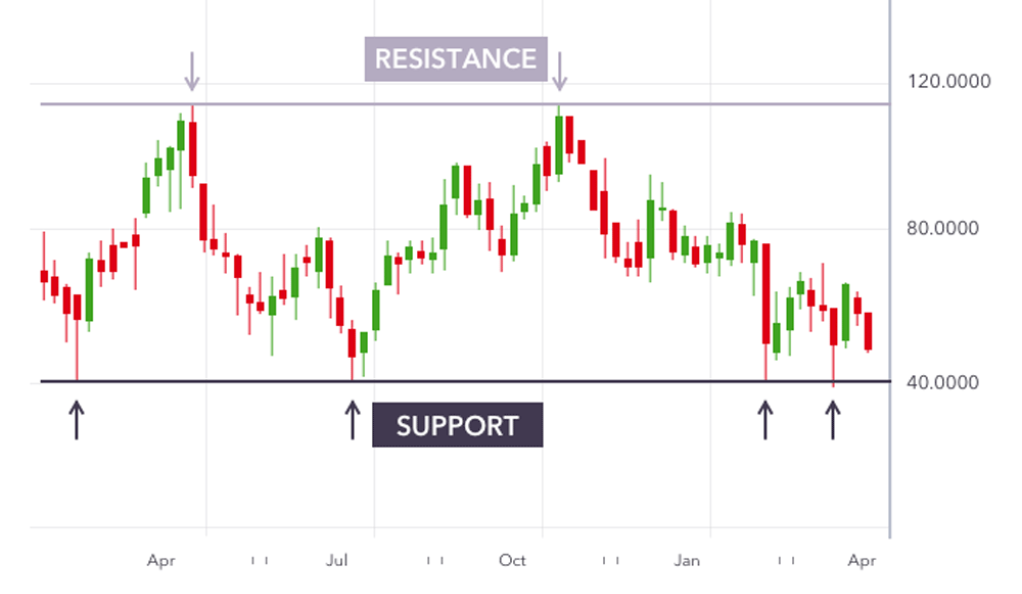
Support and resistance levels
Support and resistance levels are closely related to the concept of retracement. These are the levels at which retracement is likely to occur.
Support levels are the prices at which a stock has difficulty falling further below. A resistance level is the inverse of a support level. It represents a price at which a stock has difficulty climbing above.
Fibonacci retracement serves as one way to identify support and resistance levels.
Entry and exit signals
While Fibonacci retracement is a useful strategy in itself, it is not enough to form a complete trading methodology. The reason why is that Fibonacci retracement can really only identify possible areas of support and resistance. By itself, it does not provide adequate signals to determine whether entry or exit of an asset is appropriate.
For example, consider a Fibonacci level has been identified at $200 for a stock. On its own, this doesn’t tell you much. The stock is more likely to retrace itself near $200, but it could eventually break out and move upward, or reverse and fall back down.
That’s why other technical indicators, which might depend on price history or volume, are important to use to identify entry and exit signals.
Methodology and Techniques
Using the art of Fibonacci retracement for profitable trading requires using appropriate techniques. Let’s review some basic methodology to use the strategy effectively.
Identify major price changes
One of the reasons that Fibonacci retracement is an ‘art’ is due to the discretion traders have in putting the strategy into practice. This starts with the subjectivity of identifying major price changes.
Whether you’re analyzing an uptrend or a downtrend, you’ll need to find the significant price movement’s peak and trough. Depending on the time frame being analyzed, the definition of a significant movement may vary.
Once the peak and trough are identified, Fibonacci levels can actually be created based on those prices. Clearly, which price change is chosen, and which prices are identified as the peak and trough, matter a lot. In reality, it will likely take some practice to figure out which types of major price change work for your trading strategy.
Properly draw Fibonacci levels
Ensure you are drawing your Fibonacci levels at pre-determined places along the chart. Most traders use the common level values of 23.6%, 38.2%, 50%, and 61.8%. For an uptrend, this means placing levels at 23.6% of the price movement down from the peak, 38.2% down, and so on.
A common mistake is thinking that the Fibonacci level is determined as a percentage of the price itself. In fact, you calculate the level based on the overall price movement.
As you continue trading, you might identify other percentage levels that work for your strategy. It’s important to test these levels over time, however, and not add new ones haphazardly.
Use other technical indicators
You’ll likely need to use other technical indicators in coordination with Fibonacci retracement to use the strategy effectively.
We briefly discussed this when looking at the key concepts relating to Fibonacci retracement, but the logic is simple. On its own, Fibonacci levels can only tell you where you need to be alert and aware as the stock price changes. Whether or not to take action is up to the trader.
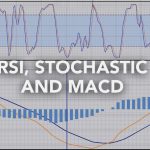
Unless you plan on using your gut instinct to trade, this will almost certainly involve leveraging technical indicators to trade. Some popular indicators for entry and exit signals include moving averages, relative strength indexes, or convergence/divergence calculations.
Case Study
Now that we have a sound understanding of Fibonacci retracements, as well as the techniques and concepts of the system, let’s take a look at a case study.
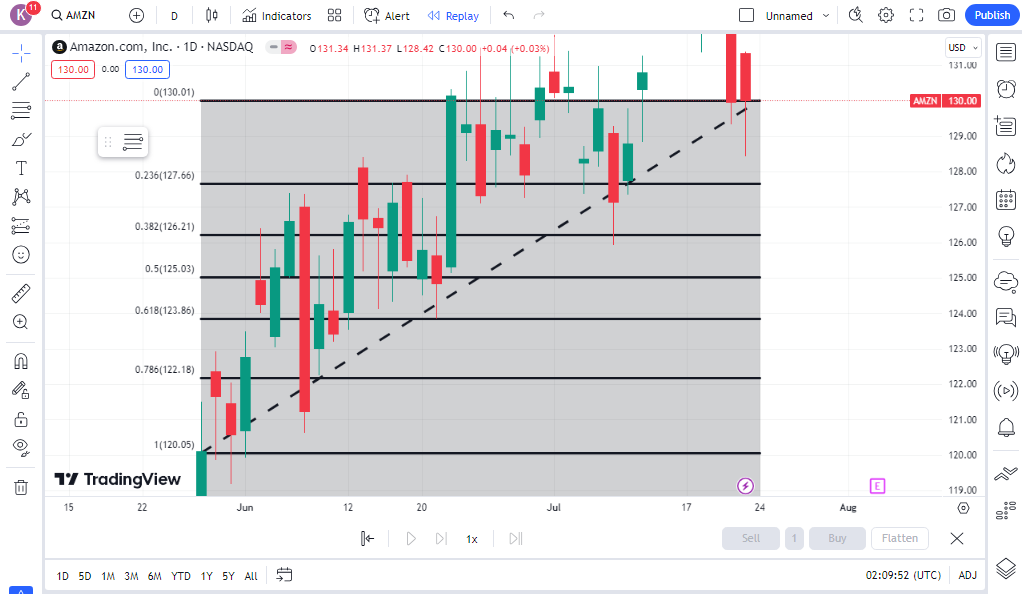
- Choose a stock to trade: To use our Fibonacci retracement system, of course, we’ll need an asset to trade. Let’s say we think the technical characteristics of AMZN look good, and pick that one to trade.
- Identify a significant price movement: The definition of significant is subjective, but let’s say we pick a day when AMZN jumped from $120 to $130. These two levels will be our trough and peak to analyze our uptrend.
- Draw Fibonacci levels: Most trading software will do this for us, so it’s unlikely we’ll be drawing any of our levels by hand. Based on the $10 price movement and using standard Fibonacci levels, we’ll draw lines at $127.64, $126.18, $125, and $123.82.
- Wait for the stock to hit Fibonacci levels: If the stock begins to retrace itself by falling below $130, we can monitor it as it hits the various levels we described.
- Use another indicator to determine entry: Let’s say we chose to use a moving average crossover to identify possible trend reversals in coordination with our Fibonacci retracement. Suppose the stock falls to around $127.64 and sits there for a while. We might be tempted to buy, but it’s important to be patient unless our crossover is activated. When the stock falls again to $126.18, let’s say our secondary signal is triggered. Then we can buy the stock and enter the trade.
- Determine exit strategy: Now that you’ve entered the trade, make sure you have an exit criterion in place for when you’ll sell your position. It’s also popular to set a stop loss when using Fibonacci retracement, typically right below the next Fibonacci level. In this case, that’s $125.
In this case study, we picked a stock, calculated our Fibonacci levels, and used those levels along with another indicator to time our trade effectively. While we hope our indicator was correct about the trend, it’s vital to have some exit strategy in place to manage the risks of trading.
Potential Risks
Using the art of Fibonacci retracement to identify critical prices is popular, but there are risks involved. In this section, we’ll go over a few potential risks you’ll need to manage to effectively use this tool.
Subjectivity
As we mentioned previously, Fibonacci levels can be very subjective depending on a trader’s definition of ‘significant price movement.’ Since the peak and trough chosen have a huge influence on where Fibonacci levels will be drawn, there is a risk that a trader chooses an inappropriate price movement.
False levels
Fibonacci levels don’t work in all cases. Sometimes, a stock will blow through a supposed Fibonacci level, rather than slow down and perform some retracement.
While Fibonacci retracement can alert traders to the prices they need to be aware of, there is no guarantee that every level will be respected. Over time, traders should learn the levels that work best with certain assets and asset classes.
Poor indicator pairing
While Fibonacci levels can identify key asset levels, a secondary indicator is all but required to effectively determine entry and exit. This indicator might be chosen poorly.
The indicator might be ineffective overall or just when paired with Fibonacci retracement. In either case, this will significantly affect a trader’s profitability, and thus the utility of the Fibonacci retracement system.
Conclusion
Fibonacci retracement is different than other technical indicators in the sense that it can only tell you the price levels to pay attention to. On its own, it can’t give much information about when to enter and exit a position.
In addition, the Fibonacci retracement has its origins at the intersection of nature and mathematics. This might leave some traders wondering about its applicability to financial markets.
Like other technical methods, however, Fibonacci retracement is just one more tool in a trader’s belt. For some trading styles, it will be a very complementary method. Other styles will be better suited with different tools.
The only way to find out for yourself, though, is to fire up your trading software and start experimenting with Fibonacci retracement!
FAQ
How to use Fibonacci retracement?
Fibonacci retracement levels can be used to identify possible areas of support and resistance for an asset. At these levels, an asset may retrace itself before continuing its trend, or reverse its momentum entirely.
How to draw Fibonacci retracements?
To do so manually, you’d determine the dollar amounts corresponding to the appropriate percentage changes of an overall price movement. In practice, though, trading software will handle this for you.
What is Fibonacci extension?
A Fibonacci extension strategy expands the original conception of Fibonacci retracement. While Fibonacci retracement has to do with an asset ‘retracing’ its steps, Fibonacci extension methods aim to project an asset’s important levels beyond an initial trend.
WeInvests is a financial portal-based research agency. We do our utmost best to offer reliable and unbiased information about crypto, finance, trading and stocks. However, we do not offer financial advice and users should always carry out their own research.
Read More