Candlestick patterns play a crucial role in the trading universe, providing valuable insights into market trends and helping traders make informed decisions. This article delves into the significance of candlestick patterns and their impact on trading strategies. It explores how these patterns are formed and how they can be interpreted to predict market movements.
By understanding various types of candlestick patterns, traders can identify potential reversals, continuations, and trend formations in different financial market environments. The article also highlights the importance of incorporating candlestick analysis alongside other technical indicators and risk management techniques to enhance potential trading success.

Basics of Candlestick Patterns
Candlestick patterns are a popular tool used in technical analysis to analyze and predict price movements in financial markets. They originated in Japan back in the 18th century and were first used by rice merchants for tracking market trends.
Each candlestick consists of four main components: the open, close, high, and low prices. The “body” of the candlestick represents the range between the open and closed prices, while the “wicks” or “shadows” represent the range between the high and low prices. The color of the body (usually green or white for bullish candles and red or black for bearish candles) indicates whether the price closed higher or lower than it opened.
Candlestick patterns differ from traditional bar charts in their visual representation and the information they convey. Candlestick charts provide a more visually intuitive and comprehensive view of price action, allowing traders to easily identify patterns and trends.
There are numerous benefits of using these patterns in trading activity, as they offer valuable insights into market psychology, thus helping traders understand the balance between buyers, sellers, and prevailing market sentiments. Candlestick patterns can indicate potential reversals, trend continuations, or consolidation phases. Hence, they also provide entry and exit signals for trades.
Single Candlestick Patterns
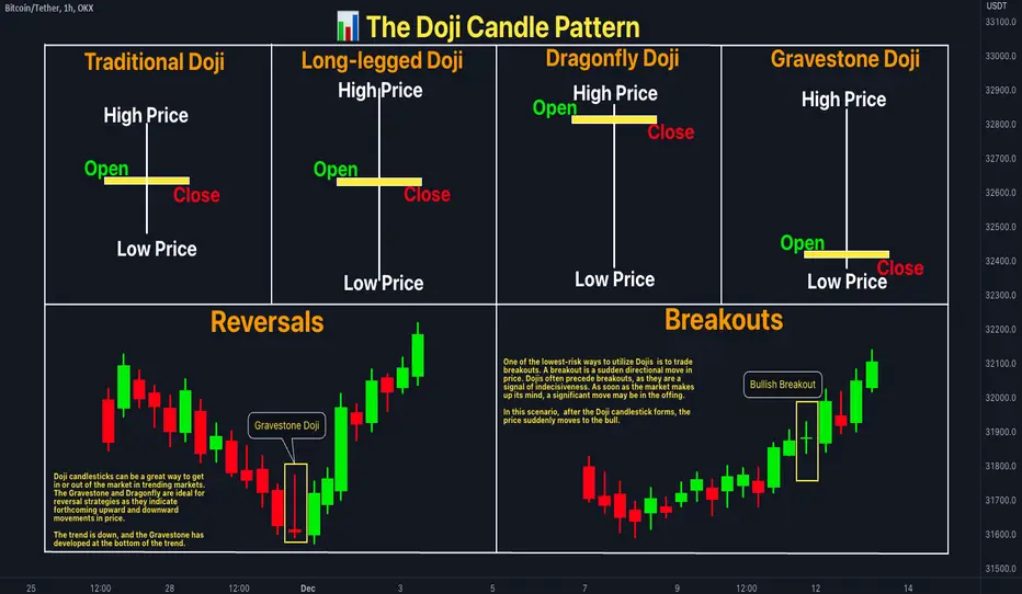
Doji: A candlestick pattern with a small body, indicating that the open and close prices are nearly equal, creating a cross-like appearance. It suggests indecision in the market and potential trend reversals.
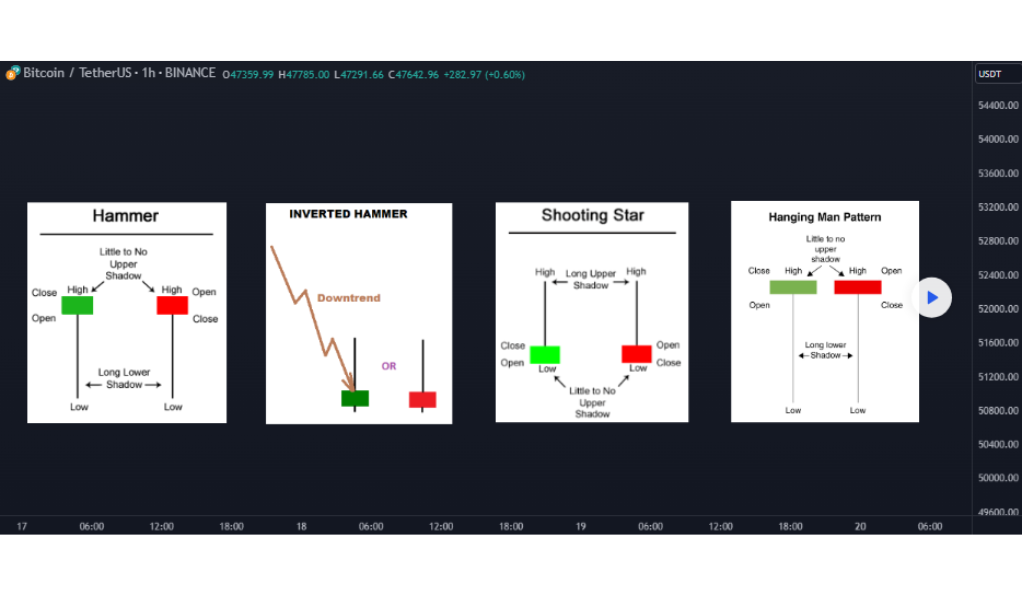
Hammer: A bullish reversal pattern characterized by a small body at the top and a long lower shadow. It signifies a potential trend reversal from bearish to bullish.
Shooting Star: A bearish reversal pattern that has a small body at the bottom and a long upper shadow. It suggests a potential trend reversal from bullish to bearish.
Spinning Top: A candlestick pattern with a small body and long upper and lower shadows. It indicates indecision in the market and a potential trend reversal.
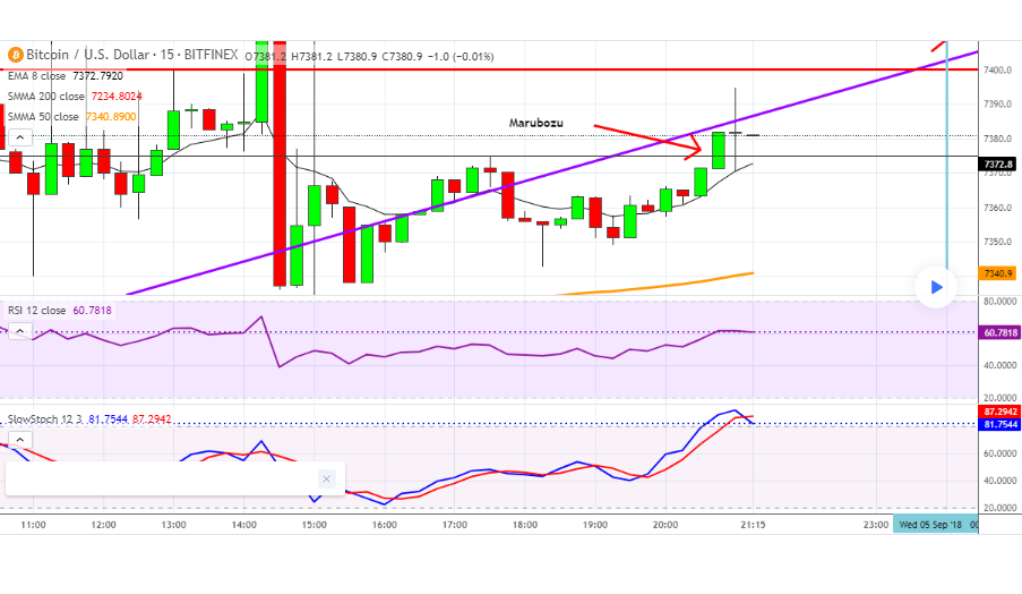
Marubozu: A candlestick pattern with a long body and little to no shadows. A bullish marubozu has no upper or lower shadow, indicating strong buying pressure. A bearish marubozu has no shadows and suggests strong selling pressure.
Piercing Pattern: A bullish reversal pattern formed by two candlesticks. The first candlestick is bearish, followed by a bullish candlestick that opens below the previous close but closes more than halfway into the previous candlestick’s body.
Hanging Man: A bearish reversal pattern with a small body and a long lower shadow, occurring at the top of an uptrend. It suggests a potential trend reversal to the downside.
Inverted Hammer: A bullish reversal pattern with a small body and a long upper shadow, occurring at the bottom of a downtrend. It suggests a potential trend reversal to the upside.
Gravestone Doji: A bearish reversal pattern with a small body and a long upper shadow, indicating potential trend reversal from bullish to bearish.
Explore the fascinating world of candlestick patterns that every trader should know. From doji and hammer to engulfing and shooting star, uncover the meanings and implications behind these powerful patterns. Equip yourself with the knowledge to make informed trading decisions using eToro’s comprehensive resources and take your trading strategies to new heights.
Two-Candlestick Patterns
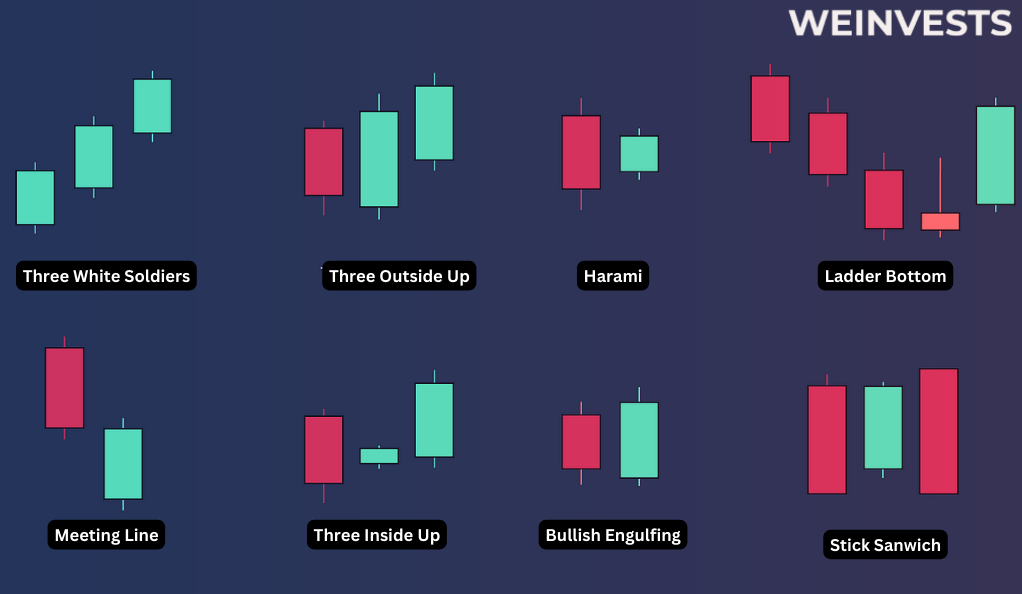
- Bullish/Bearish Harami: A bullish/bearish reversal pattern consisting of a small bearish/bullish candlestick followed by a larger bullish/bearish candlestick that is completely engulfed within the range of the previous candlestick.
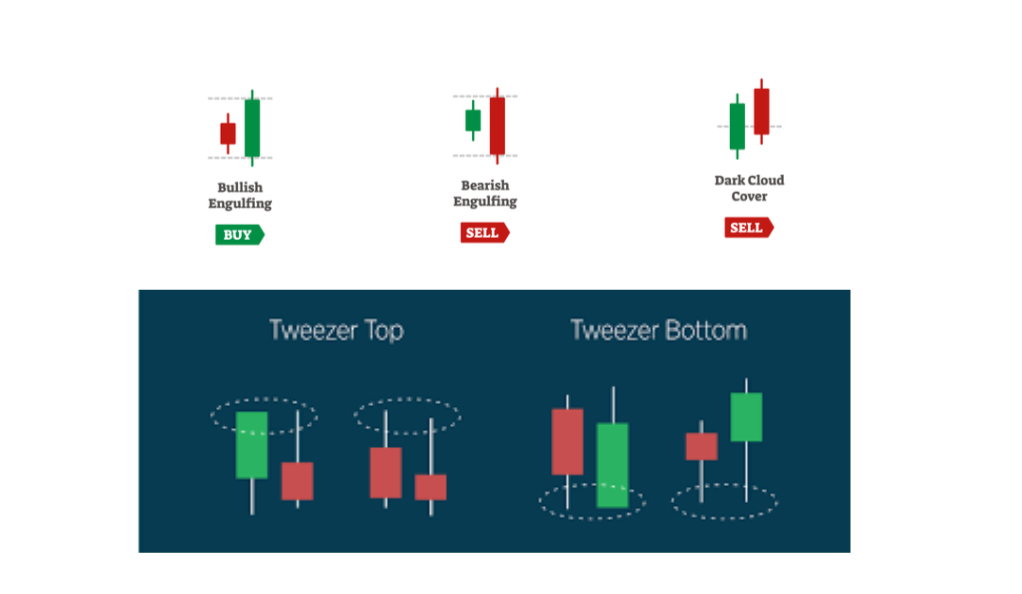
- Bullish Engulfing/Bearish Engulfing: A bullish/bearish reversal pattern where a small bearish/bullish candlestick is followed by a larger bullish/bearish candlestick that engulfs the entire range of the previous candlestick.
- Piercing Line: A bullish reversal pattern formed by a bearish candlestick followed by a bullish candlestick that opens below the previous close but closes above the midpoint of the previous candlestick.
- Dark Cloud Cover: A bearish reversal pattern consisting of a bullish candlestick followed by a bearish candlestick that opens above the previous close but closes below the midpoint of the previous candlestick.
- Morning/Evening Star: A bullish/bearish reversal pattern formed by a bearish/bullish candlestick followed by a small candlestick (with a gap) that indicates indecision, and finally a bullish/bearish candlestick that closes near the first candlestick’s opening.
- Tweezer Tops/Bottoms: A bearish/bullish reversal pattern with two candlesticks of similar highs/lows, suggesting potential resistance/support and a possible trend reversal.
Three-Candlestick Patterns
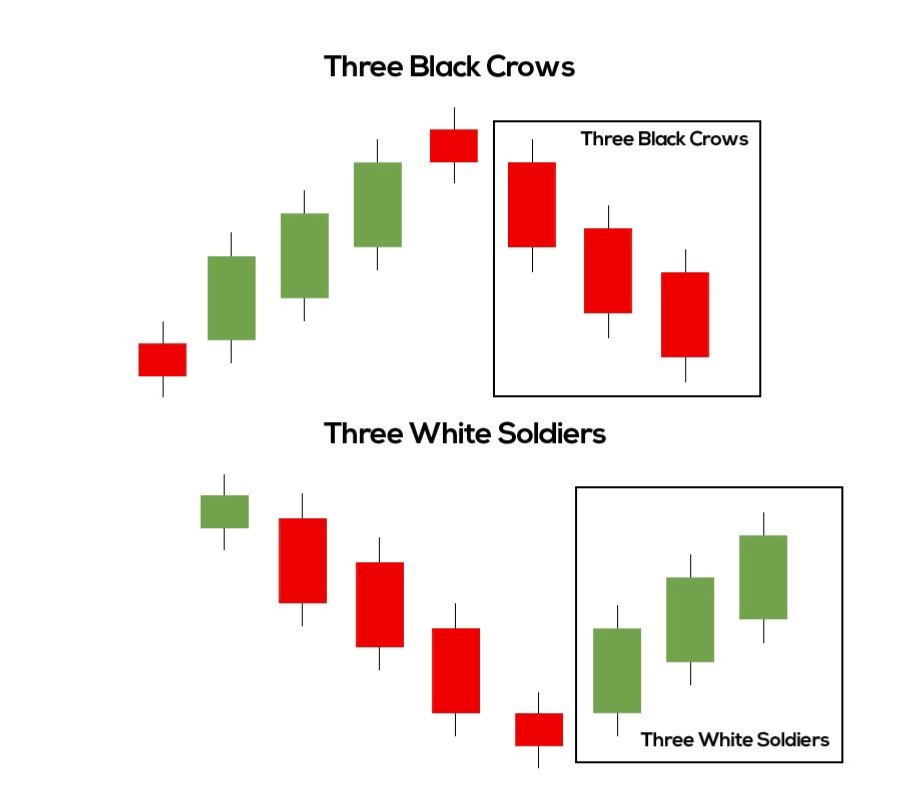
- Three White Soldiers: A bullish reversal pattern characterized by three consecutive long bullish candlesticks with small or no shadows. Each candlestick opens within the range of the previous one and closes higher, indicating strong buying pressure and a potential trend reversal to the upside.
- Three Black Crows: A bearish reversal pattern that consists of three successive lengthy bearish candlesticks with little to no or very little shadow. Each candlestick shows significant selling pressure and a probable downward trend reversal by opening inside the preceding candlestick’s range and closing lower.
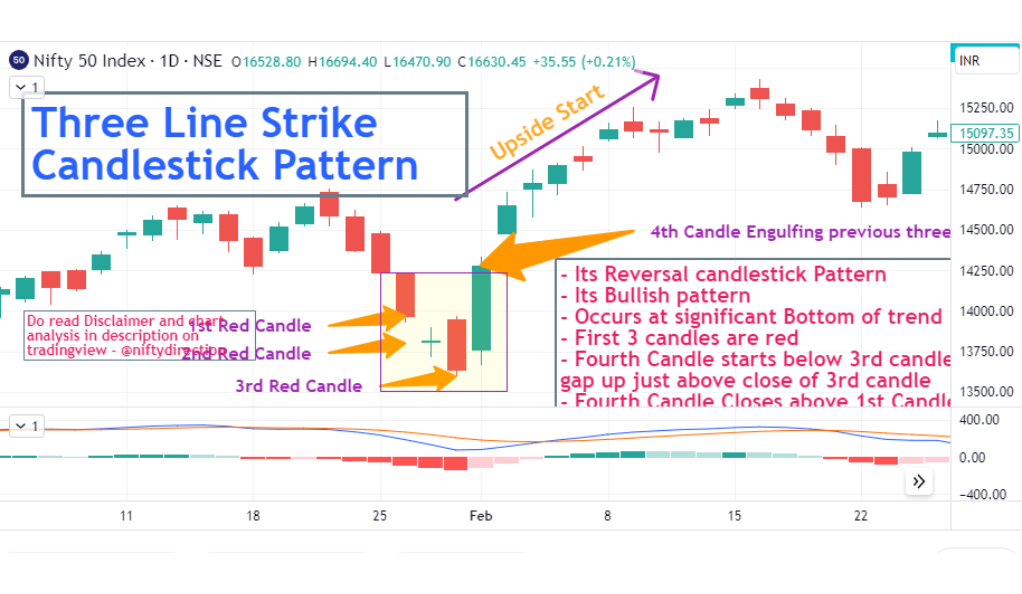
- Bullish/Bearish Three-Line Strike: These patterns are formed by four candlesticks. In the bullish version, the first three candlesticks are bearish, while the fourth is a long bullish candlestick that completely engulfs the previous three. It suggests a strong bullish reversal. Conversely, in the bearish version, the first three candlesticks are bullish, and the fourth is a long bearish candlestick that engulfs the previous three, indicating a strong bearish reversal.
Four-Candlestick Patterns
- Rising Three Methods: A bullish continuation pattern where a long bullish candlestick is followed by three small bearish candlesticks that remain within the range of the first candlestick.
- Falling Three Methods: A bearish continuation pattern consisting of three brief bullish candlesticks that remain inside the first candlestick’s range after a long bearish candlestick.
Complex Candlestick Patterns
- Head and Shoulders: A bearish reversal pattern characterized by a central peak (the head) flanked by two smaller peaks (the shoulders), indicating a potential trend reversal from bullish to bearish.
- Double Tops and Bottoms: These patterns occur when the price reaches a resistance level (double top) or a support level (double bottom) twice, suggesting a potential trend reversal.
- Triple Tops and Bottoms: Similar to double tops and bottoms, these patterns occur when the price reaches a resistance level (triple top) or a support level (triple bottom) three times, indicating a stronger potential trend reversal.
Candlestick Patterns for Reversals and Continuations
Candlestick patterns play a significant role in identifying both – trend reversals and continuations in the market. Reversal patterns, such as the head and shoulders, double tops and bottoms, and triple tops and bottoms, provide signals that suggest a potential shift in the prevailing trend. These patterns indicate a weakening of the current trend and the possibility of a reversal in the opposite direction.
On the other hand, continuation patterns, such as the rising three methods and falling three methods, serve to confirm the existing trend. These patterns suggest a temporary pause or consolidation within the ongoing trend, indicating that the price is likely to continue moving in the same direction after the pattern completes.
By recognizing these reversal and continuation patterns, traders can make more informed decisions about entry and exit points, managing their risk more effectively and capitalizing on potentially profitable trading opportunities.
Candlestick Patterns for Different Timeframes
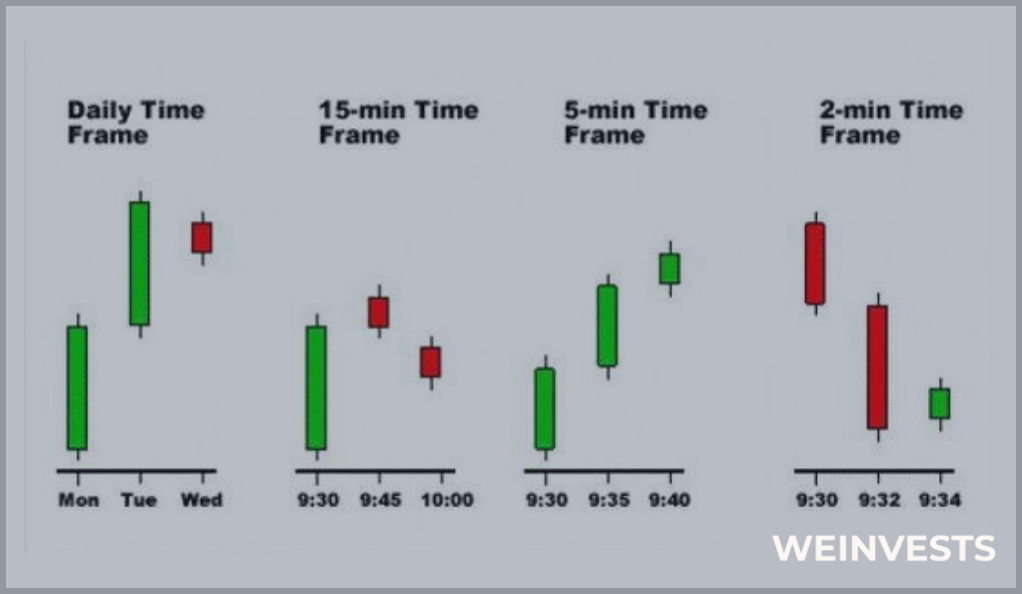
Intraday candlestick patterns focus on shorter timeframes, such as minutes or hours. Traders engaged in day trading use patterns like doji, engulfing, and hammer to identify potential reversals or continuations within the same trading day. These patterns help them make quick trading decisions based on intraday price movements.
Daily candlestick patterns are widely used by swing traders and longer-term traders. Patterns like bullish engulfing, morning star, and bearish harami provide signals for potential trend reversals or continuations on a daily basis. Traders analyze these patterns to determine entry and exit points for trades held over several days or weeks.
Weekly and monthly candlestick patterns are more often used by long-term traders and investors, offering insights into the broader market trends and helping the market participants to identify major reversals or continuations. Examples include long-legged doji, shooting star, and bullish three-line strike. Traders and investors use these patterns for making decisions on their longer-term positions as well as portfolio management strategies.
Trading Strategies Using Candlestick Patterns
For scalping techniques, traders focus on shorter timeframes and utilize patterns like doji, engulfing, and hammer to quickly identify potential reversals or continuations for short-term trades.
Swing trading strategies involve holding positions for several days to weeks. Traders use patterns like bullish engulfing, morning star, and bearish harami to identify potential trend reversals or continuations and arrange their trades accordingly.
Position trading approaches are for longer-term investors who hold positions for weeks, months, or even years. Patterns like long-legged doji, shooting star, and bullish three-line strike help traders make decisions on when to enter or exit positions, based on significant trend reversals or continuation.
Tips for Using Candlestick Patterns Effectively
To effectively use candlestick patterns in trading, you may wish to consider the following tips:
- Pay attention to the volume accompanying the formation of candlestick patterns. High trading volume can validate the significance of the pattern, increasing its reliability. For example, a bullish pattern accompanied by high volume suggests stronger buying pressure and increases the probability of a successful trade.
- Enhance the accuracy of your trading decisions by combining candlestick patterns with other technical indicators, such as moving averages, trend lines, or oscillators. The convergence of multiple signals can provide stronger confirmation and increase the reliability of your trades.
By incorporating these tips into your trading strategy, you can utilize candlestick patterns more effectively, making them a valuable tool for better-informed trading decisions and thus increasing the likelihood of your trading success.
Summary
If used intelligently, candlestick patterns may gain great importance in trading activity, providing valuable insights into market trends and catering to more balanced decision-making. This article highlighted the significance of understanding and utilizing various types of such patterns for shaping your trading strategies for better potential success.
We covered various types of those, such as single-candlestick patterns like Doji, Hammer, Shooting Star, and others, as well as two-candlestick patterns such as Bullish/Bearish Harami and Engulfing. Additionally, we discussed three-candlestick patterns like Three White Soldiers, Black Crows, and Bullish/Bearish Three-Line Strikes, as well as more complex patterns.
The key takeaways include recognizing the patterns’ formations, understanding their implications for trend reversals or continuations, and incorporating them with other available tools of technical analysis. By mastering candlestick patterns, traders can significantly enhance their ability to interpret market sentiment, taking more informed trading decisions.
FAQ
What are the most reliable candlestick patterns?
The reliability of candlestick patterns can vary depending on market conditions and timeframes. However, some commonly recognized reliable patterns include engulfing, morning star, evening star, and doji.
How do I interpret multiple candlestick patterns?
When interpreting multiple candlestick patterns, it is essential to consider the relationship between the patterns, their context within the market, and the prevailing trend. It’s advisable to look for confirmation signals in considering other technical indicators to validate the observed patterns in order to make better trading decisions.
Can candlestick patterns be used for day trading?
Yes, candlestick patterns can be used for that purpose. Day traders commonly rely on shorter timeframes to identify and capitalize on intraday price movements using shorter patterns. However, it’s crucial to combine them with other technical tools and risk management principles for a more effective day trading experience.
WeInvests is a financial portal-based research agency. We do our utmost best to offer reliable and unbiased information about crypto, finance, trading and stocks. However, we do not offer financial advice and users should always carry out their own research.
Read More