In the dynamic world of trading, where decisions are often made in the blink of an eye, understanding various patterns is essential for success. Chart patterns provide valuable insights into market trends, allowing traders to anticipate potential price movements and make informed decisions. Among the different chart patterns, the ascending and descending triangle patterns have garnered significant attention.
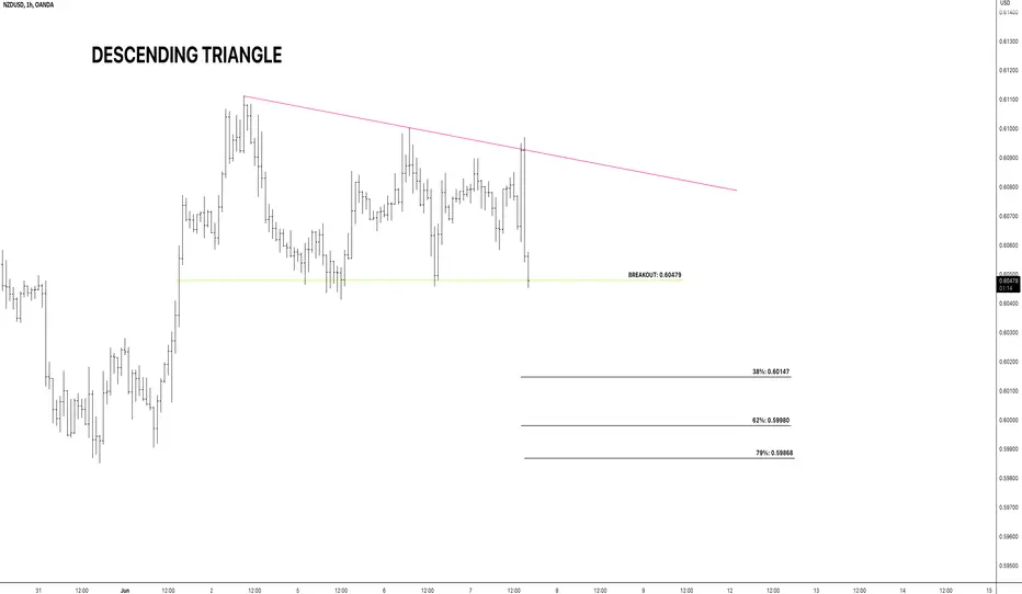
The ascending triangle pattern is characterized by a flat upper resistance line and a rising trendline, creating a triangular shape. This pattern indicates a potential bullish breakout. On the other hand, the descending triangle pattern features a declining upper resistance line and a horizontal support line, forming a triangle with a downward slope. This pattern suggests a possible bearish breakout, with sellers exerting pressure and pushing the price lower.
Trading with these patterns offers several advantages. Firstly, they provide clear entry and exit points, aiding traders in setting up potentially profitable trades. Additionally, these patterns often generate strong price movements, presenting attractive profit opportunities.
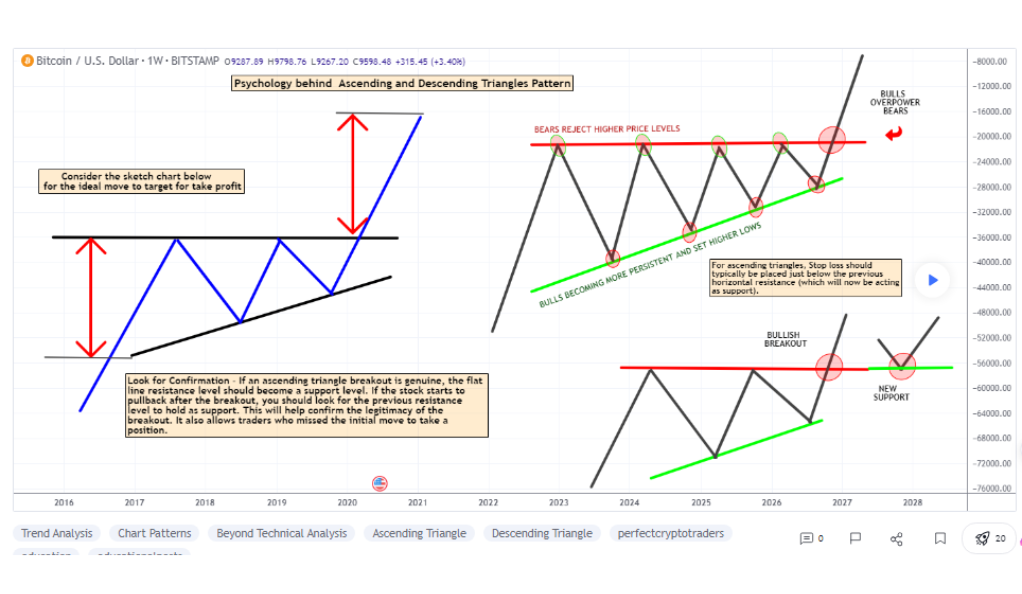
Table of Contents
The Basics of Ascending/Descending Triangle Patterns
Definition and Characteristics
An ascending triangle pattern is a bullish chart pattern frequently utilized in technical analysis. This pattern typically develops when the price of an asset experiences a series of higher lows, indicating increasing buying pressure.
The rising trendline of an ascending triangle represents the upward momentum of the asset, while the flat upper resistance line acts as a barrier preventing further price advancement. As the pattern unfolds, the distance between the two lines narrows, indicating a period of consolidation.
Traders usually pay close attention to this pattern, as it often signals a continuation of the existing uptrend. The breakthrough of the upper resistance line is considered a bullish signal, often leading to a significant price surge. Confirmation of the pattern’s validity is usually sought through an increase in trading volume when the breakout occurs.
Formation and Structure
The formation of an ascending triangle pattern occurs as a result of market dynamics and investor sentiment. This pattern typically begins with an upward trend when buyers consistently push the price higher. As the price reaches a certain level, sellers enter the market, creating resistance and causing the price to temporarily stall or consolidate.
During this consolidation phase, the ascending triangle pattern takes shape. The rising trendline is formed by connecting the higher lows, indicating that buyers are willing to step in at progressively higher levels. The upper resistance line is created by connecting the relatively flat highs, signifying a price level where selling pressure is encountered.
The structure of the ascending triangle pattern consists of two converging lines that form a triangle. The upper resistance line acts as a horizontal barrier, limiting further upward movement, while the rising trendline provides support to the price. The triangle pattern is characterized by diminishing price volatility as the range between the support and resistance lines narrows over time.
Identifying Ascending/Descending Triangle Patterns
To identify ascending/descending triangle patterns, traders visually analyze price charts for flat upper resistance lines and rising (ascending) or falling (descending) trendlines. Volume plays a significant role in confirming the patterns, with increased volume during breakouts adding validity and indicating strong buying/selling pressure.
Unravel the secrets of ascending and descending triangle patterns with eToro, a reliable platform for traders. Learn how to identify and interpret these powerful chart patterns, and leverage eToro’s advanced tools to capitalize on potential breakout opportunities. Elevate your trading game with eToro’s comprehensive resources and unlock the potential of triangle patterns today.
Trading Strategies with Ascending/Descending Triangle Patterns
Ascending Triangle Pattern Trading Strategies
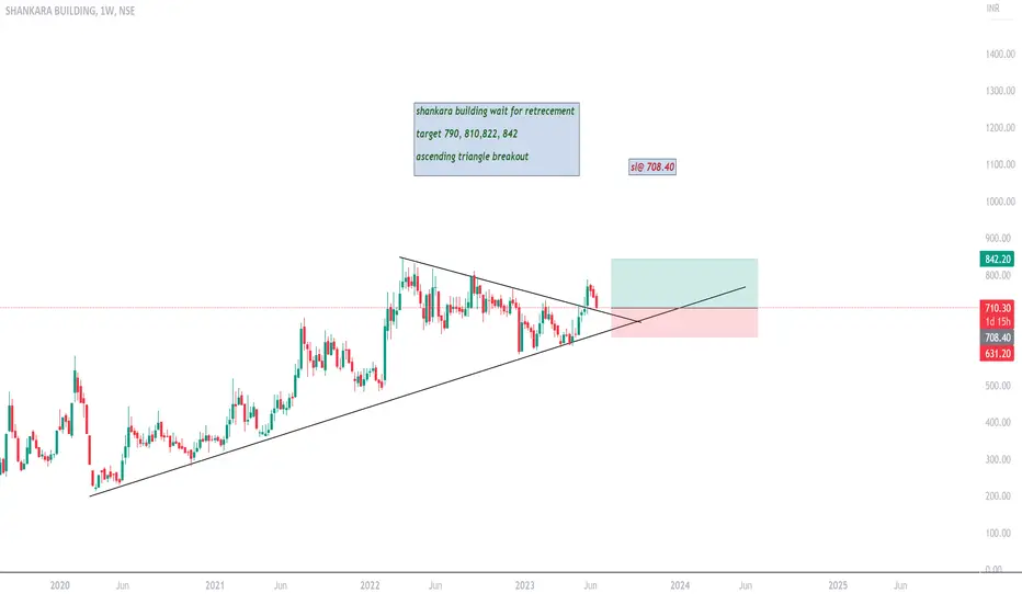
Traders often employ a breakout strategy when trading ascending triangle patterns. This strategy involves waiting for a clear breakout above the upper resistance line. Once the breakout occurs, traders enter a long position, anticipating a continuation of the upward trend. To validate the breakout, traders may look for increased volume accompanying the price surge. Stop-loss orders can be placed below the breakout point to manage risk.
Another strategy for trading ascending triangles is the pullback strategy. After a breakout above the upper resistance line, traders wait for a price pullback toward the breakout level or the rising trendline. This pullback provides an opportunity to enter a long position at a potentially more favorable price. Traders can set stop-loss orders below the pullback level to protect against a reversal.
Traders often use the height of the ascending triangle pattern to estimate a target price. The height is measured from the lowest point of the triangle’s base (the point where the trendline starts) to the upper resistance line. This measurement is then added to the breakout level to determine a potential target price. It is important to note that this is a rough estimate, and other factors such as market conditions and price momentum should also be considered.
These trading strategies for ascending triangle patterns provide traders with different approaches to capitalize on potential bullish opportunities. Traders need to combine these strategies with proper risk management techniques, including setting stop-loss orders and considering overall market conditions, to increase the likelihood of successful trades.
Descending Triangle Pattern Trading Strategies
Traders often employ a breakdown strategy when trading descending triangle patterns. This strategy involves waiting for a clear breakdown below the horizontal support line. Once the breakdown occurs, traders enter a short position, anticipating a continuation of the downward trend. Confirmation of the breakdown can be sought through increased volume accompanying the price decline. Stop-loss orders can be placed above the breakdown point to manage risk.
Another strategy for trading descending triangles is the retest strategy. After a breakdown below the support line, traders wait for a price retest of the breakdown level or the declining trendline. This retest provides an opportunity to enter a short position at a potentially more favorable price. Traders can set stop-loss orders above the retest level to protect against a reversal.
Traders can use the height of the descending triangle pattern to estimate a target price. The height is measured from the highest point of the triangle’s base (the point where the support line starts) to the horizontal support line. This measurement is then subtracted from the breakdown level to determine a potential target price. It is important to note that this is a rough estimate, and other factors such as market conditions and price momentum should also be considered.
Risk Management and Position Sizing
In triangle pattern trading, risk management is paramount for preserving capital and ensuring long-term trading success. Effective risk management involves implementing strategies to limit potential losses and protect against adverse market movements.
Position sizing is a crucial aspect of proper risk management. Traders determine the appropriate position size based on their risk tolerance and the characteristics of the trade setup. One commonly used method is the percentage risk model, where traders allocate a specific percentage of their trading capital to each trade. This ensures that no single trade carries excessive risk, even if multiple trades result in losses.
Additionally, setting stop-loss orders is essential in managing risks. Traders define a predetermined point at which they will exit the trade if the price moves against their expectations. Stop-loss orders help limit possible losses and protect capital from significant drawdowns. It is fundamental to strike a reasonable balance between risk and reward when trading triangle patterns.
Real-Life Examples and Case Studies
Ascending Triangle Pattern Examples
- Case study: trading a bullish breakout in the stock market
In a case study of trading an ascending triangle pattern, a trader identifies the formation of an ascending triangle on the price chart of a particular stock. He/she then waits for a clear breakout above the upper resistance line, accompanied by increased trading volume as confirmation.
Once the breakout occurs, the trader enters a long position, expecting the stock price to continue rising. Profit targets can be set based on the height of the triangle, and a stop-loss order in place to manage potential losses.
- Real-life example: trading an ascending triangle in the cryptocurrency market
In the crypto-market also, ascending triangle patterns offer trading opportunities. For example, a trader spots an ascending triangle forming on the price chart of a watched cryptocurrency. He/she identifies a flat upper resistance line and a rising trendline, indicating the potential for a bullish breakout.
The trader patiently waits for the breakout above the upper resistance line, seeking confirmation through increased trading volume. Once the breakout occurs, the trader enters a long position, anticipating further upward movement in that cryptocurrency’s price. To manage risk, a stop-loss order is placed below the breakout level.
As the price continues to rise, the trader may scale out of the position at different target levels. The trader can estimate target prices by considering the height of the triangle. However, it’s important to consider other factors such as historical price levels, overall market conditions, and specific news events related to the subject of cryptocurrency.
Descending Triangle Pattern Examples
- Case study: trading a bearish breakdown in the Forex market
The creation of a descending triangle on the price chart of a currency pair is identified by the trader in a case study of trading descending triangle patterns in the forex market. The trader watches for a distinct breakdown below the lower support line and increasing trading volume as confirmation.
When the breakdown takes place, the trader opens a short position, anticipating that the currency pair will keep moving downward. Based on the triangle’s height, profit objectives may be established, and a stop-loss order can be put to limit possible losses.
- Real-life example: trading a descending triangle in the commodity market
In the commodity market, descending triangle patterns also provide trading opportunities. For instance, a trader identifies a descending triangle forming on the price chart of a commodity. The trader waits for a breakdown below the lower support line, with increased trading volume as confirmation.
Upon the breakdown, the trader enters a short position, anticipating further downward movement in the commodity’s price. Profit targets can be determined using the triangle’s height, while a stop-loss order helps manage the risks. Considering factors like historical price levels, overall market conditions, and specific news events related to the commodity can further enhance the trading results.
Common Mistakes to Avoid
Possible mistakes in trading triangle patterns:
- Premature Entry: One common mistake is entering a trade too early before the breakout or breakdown occurs.
- Neglecting Volume: Ignoring the volume during the formation and confirmation of triangle patterns can be a mistake.
- Incorrect Stop Placement: Placing stop-loss orders too close to the entry point or in arbitrary locations can lead to premature exits or excessive losses. Set stops based on logical levels, such as below the breakout point or above the breakdown point, to give the trade room to breathe.
- Neglecting Overall Market Context: Failing to consider broader market conditions and trends can be detrimental. It’s important to assess the overall market context and align triangle pattern trades with the prevailing market direction.
Tips to overcome these challenges:
Stay patient and wait for a clear confirmation before entering a trade. Avoid impulsive decisions based on incomplete patterns.
Implement proper risk management techniques, including setting stop-loss orders and position sizing, to protect against possible losses.
Keep learning and improving your skills in technical and financial analysis to enhance pattern recognition and improve decision-making abilities.
Summary and Key Takeaways
Trading with ascending and descending triangle patterns may offer several benefits to keen traders. Ascending triangles indicate potential bullish breakouts while descending triangles suggest bearish breakdowns. By waiting for clear breakouts or breakdowns, traders can enter positions with increased confidence. Additionally, volume confirmation is crucial for validating these patterns. Meanwhile, measuring the height of the triangle can provide for better target price estimates.
Overall, understanding and utilizing triangle patterns by traders may facilitate identifying favorable opportunities, improve decision-making, and increase the likelihood of profitable trade outcomes. By combining technical analysis, risk management, and exercising patience, traders can harness the potential of ascending and descending triangle patterns in their applied strategies.
FAQ
How can I practice trading with triangle patterns without risking real money?
You may wish to exercise your trading skills via a demo account provided by various trading platforms and practice trading with triangle patterns prior to switching to the real trading experience.
What other chart patterns may I use in combination with triangle patterns?
You could consider incorporating other chart patterns such as head and shoulders, double top/double bottom, symmetrical triangle, and pennant in conjunction with triangle patterns for a more comprehensive analysis of market dynamics.
Which timeframes can triangle patterns be applied to?
Actually, triangle patterns can be used for a wide range of different timeframes, ranging from intraday charts to daily, weekly, or even monthly charts.
WeInvests is a financial portal-based research agency. We do our utmost best to offer reliable and unbiased information about crypto, finance, trading and stocks. However, we do not offer financial advice and users should always carry out their own research.
Read More