Since markets are made up of people, can we predict market behavior by studying human behavior?
One influential technical researcher, Ralph Nelson Elliot, believed we can. In the 1930s, Elliot closely studied decades worth of stock market data of varying time scales. Through this effort, combined with his understanding of human psychology, Elliot formulated what has come to be known as Elliot wave theory (or just wave theory).
At its core, wave theory posits that markets react to recurring patterns of human sentiment. As traders get hopeful and greedy, they form a herd that drives the market higher. When doubt begins to creep in, traders eventually abandon the market, causing prices to drop.
This dynamic, which plays out both minute by minute and over the course of decades, is the source of the market waves in wave theory. In other words, the market can be predicted by understanding how bullish and bearish psychology plays out in practice.
In this article, we’ll take a deep dive into Elliot wave theory, and what investors can learn from this unique way of viewing the markets. We’ll start by taking a closer look at the intellectual framework of wave theory.
Detailed Explanation
Ralph Nelson Elliot would eventually take his understanding of wave theory and expand it to all manner of phenomena. His final book was titled ‘Nature’s Law – The Secret of the Universe.’
For our purposes, though, we don’t need to unlock any secrets of the universe. We just need to understand what exactly wave theory means.
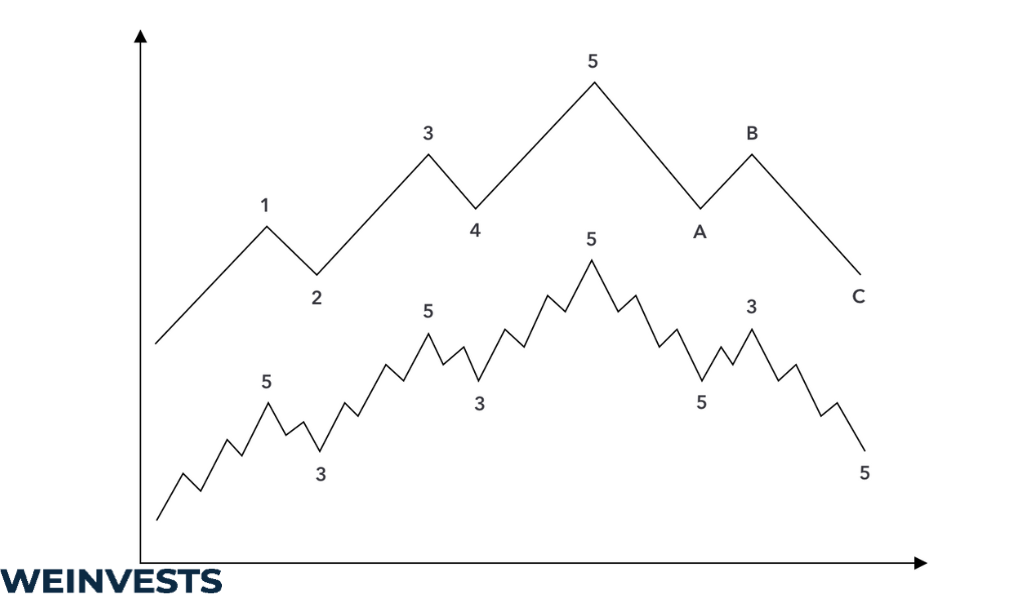
Wave theory proposes that the market moves in constantly cycling bullish and bearish waves. But no single wave exists in isolation. Within each wave contains other, smaller waves that echo bullish and bearish sentiments.
Wave theory, though, does not distinguish waves based on whether they drive the market up or down. Instead, waves are identified based on whether they reinforce the market’s existing sentiment or work against it.
The first type of wave is known as an ‘impulsive’ wave. If the market is going up, an impulsive wave will drive it higher. Conversely, if the market is falling, impulsive waves will drive it lower.
‘Corrective’ waves, meanwhile, do the opposite. If the market is rising, corrective wives will drag prices down.
Wave theory is so popular in part because the corrective and impulsive names more accurately speak to human nature than bullish and bearish do. The same herd behavior that drives prices up can drive them lower, even as some skeptics in the crowd work against the majority.
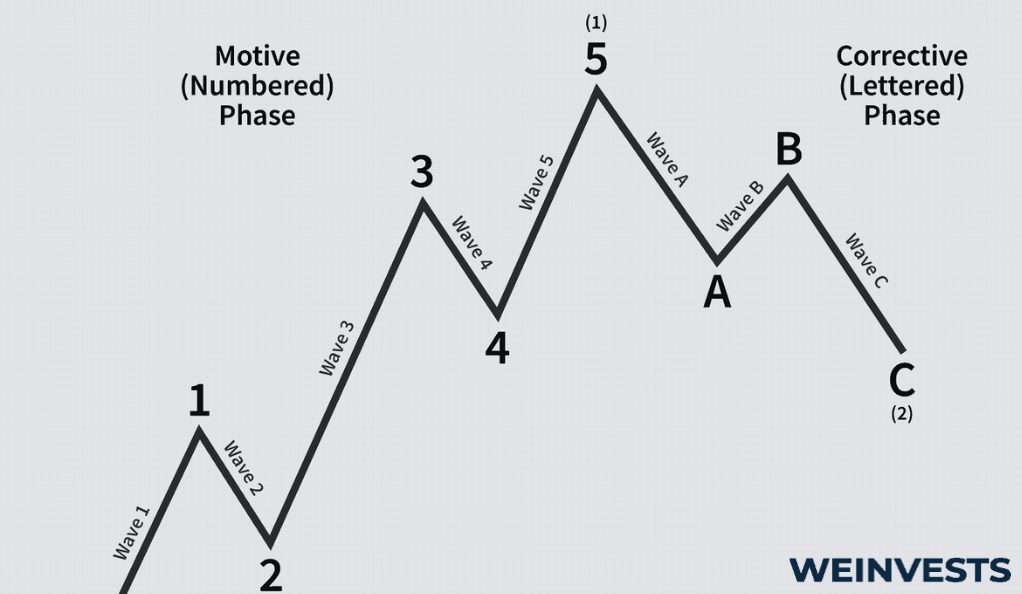
Impulsive waves are typically numbered while corrective waves are lettered. Usually, there will be five impulsive waves intercut by three corrective waves. These five impulsive waves make up one larger impulsive wave, which, when completed, could portend a market reversal.
Wave theory provides a convincing explanation for why stocks do simply rise in a straight line. Even as investors are driving prices higher, counterbalancing forces cause interment drops in the stock price.
Fully understanding the implications of game theory, though, requires studying the key concepts that serve as the theory’s foundation.
Key Concepts
Since wave theory was initially inspired by investor psychology, it should not come as a surprise that some of the foundational concepts are not rooted in finance. Let’s take a look at the basic concepts that surround wave theory.
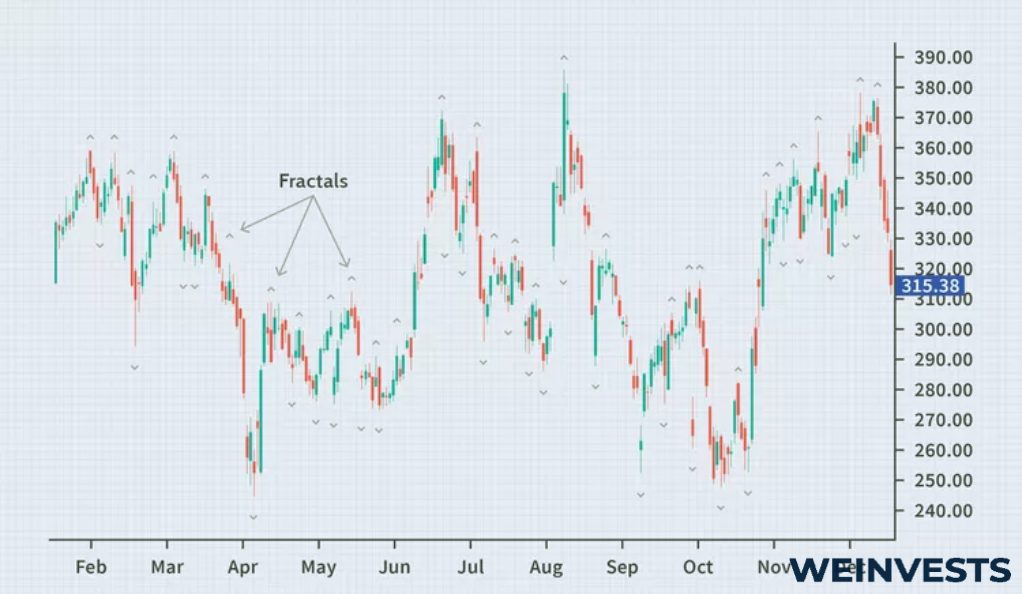
Fractal wave behavior
In wave theory, the fractal nature of markets is emphasized. Fractals commonly appear in nature and refer to a type of self-similarity where large versions of a thing contain smaller versions of itself.
With respect to wave theory, this refers to how large waves contain sub-waves of different time scales. In other words, a month-long impulsive wave will be made up of many week-long impulsive waves, which will be made of many day-long impulsive waves.
Fibonacci ratios
While Fibonacci retracement is a separate technical trading tool, wave theory does emphasize the use of Fibonacci numbers when it comes to determining certain properties of waves.
For instance, the general impulsive wave is made of five smaller impulsive waves and three corrective waves. These are both Fibonacci numbers that occur in sequence.
Ralph Nelson Elliot believed that these types of Fibonacci relationships were ever present in markets, and are therefore reflected in market waves.
Natural rhythm
Wave theory approaches markets in a slightly different manner than traders may be used to.
Ralph Nelson Elliot believed that markets, just like the natural world, had a type of rhythm. This rhythm was determined by the collective psychology of market participants, which oscillated between herd psychology and individual skepticism. This is similar to how natural cycles go through boom-and-bust periods.
Probabilistic approach
Unlike some other technical approaches, wave theory does not claim to provide a clear-cut answer as to when markets will rise and when markets will fall. Instead, wave theory takes a probabilistic approach to predicting market behavior.
While this approach might be less appealing than those that provide a precise answer, it is more realistic when it comes to the inherent uncertainty of markets.
Wave Theory Techniques
While wave theory has some interesting justification for its market analysis, we’re ultimately interested in using technical tools to achieve more profitable trading strategies. Let’s take a look at the most effective practical techniques resulting from the theory.
Wave patterns and counts
The basic unit of analysis in wave theory is the wave. It’s critical to understand the different types of waves that exist and how the unique characteristics of those waves should impact our interpretation of them.
As we mentioned, the basic impulse cycle consists of five impulsive waves. It is complemented by a basic corrective cycle that consists of three corrective waves.
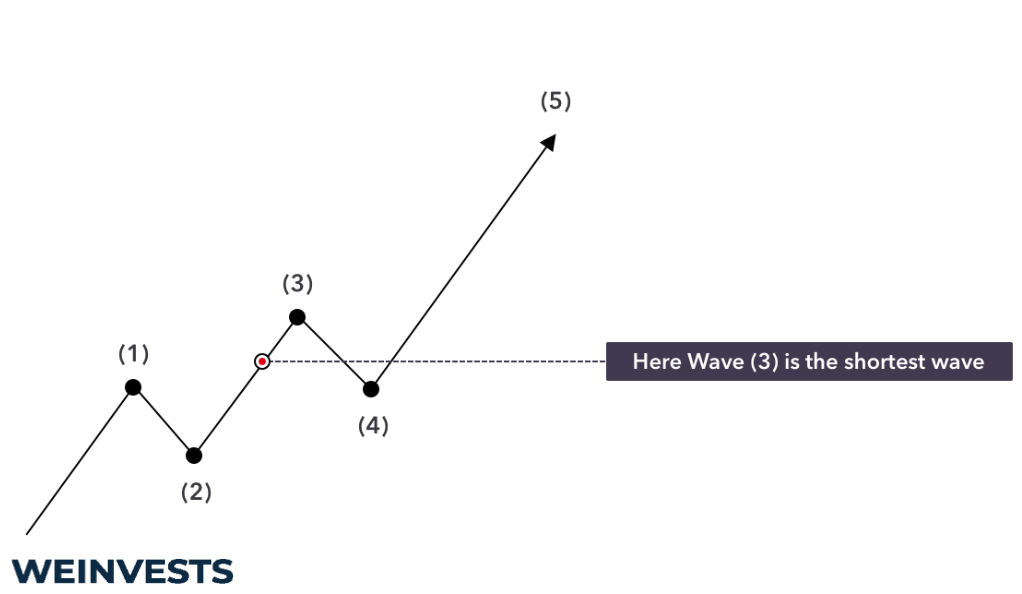
Within that basic structure, traders need to interpret the behavior of the waves to predict market movements. For instance, if each successive impulsive wave weakens, it could portend a market reversal.
Aside from the basic impulse cycle, there are a number of other possible cycles and waves. To properly interpret them, wave trades need to recognize them as patterns and appropriately count the sub-waves.
Multiple time frame analysis
Waves can exist in nearly any time period. Ralph Nelson Elliot, for instance, identified cycles that ranged from mere minutes to cycles that spanned entire centuries.
For this reason, it’s not enough to just focus on a single time period when we conduct wave analysis. Daily charts might hide waves that are taking place over the course of months or years.
For instance, suppose you identify a daily impulsive wave driving a stock price higher. While this could be a motivation to buy the stock, you might notice that it’s merely part of a month-long corrective wave driving the stock lower. While you could still profit from the short-term upward movement, such important information might make you think twice.
Confirm with other indicators
Finally, it’s important to confirm position entries and exits with other indicators.
Wave theory is a probabilistic approach. This means it can provide some predictive power about what a stock will do over some time period, but no guarantees.
To further bolster confidence about any position you take, it’s worth it to double-check with other indicators. In addition, these indicators might be able to tell you valuable information during wave cycles that are hard for you to identify.
Case Study
Now that we’ve reviewed some key concepts and techniques from wave theory, we can take a look at how the wave theory approach would work in practice.
- Select a stock based on long-term waves. If a stock is going through a long-term impulsive wave which is driving the price higher, then it’s more likely we’ll have a positive trading outcome than if the same stock had an impulsive downtrend. Let’s suppose NFLX is going through what appears to be a year-long bullish wave based on its chart.
- Identify short-term waves based on your timeframe. You’ll want to analyze the NFLX chart that aligns with your trading timeframe. Whatever chart we choose, we need to analyze the preceding price information in order to understand what type of wave NFLX is currently in. Let’s say we’ve identified a potential bullish impulsive wave forming in NFLX this week. It seems like the first four impulsive waves have been met with three corrective waves. If we’ve counted right, then NFLX should be on the verge of a fifth and final impulsive wave.
- Confirm entry with another indicator. Of course, we don’t want to trust just one source of analysis. Let’s say we also used a relative strength indicator to confirm that a basic trend reversal is likely to occur. This would give us more confidence that NFLX’s next move will be higher. Based on this, we can make our purchase.
- Monitor stock for potential wave reversals. Now that we’re in our position, we need to watch the chart to identify any wave formation that might be bad for our stock position. If the trend seems to be reversing, then we might consider taking our profit and selling. Of course, relying on our other indicator will also be useful here.
In just four steps, we picked a stock, analyzed its chart, and entered a profitable position. One of the powers of wave theory is its ease of use, especially once you’ve picked up the basic wave patterns.
This ease of use, though, comes with some potential pitfalls you need to be aware of.
Potential Risks
Elliot wave theory comes with several risks, including a couple that are unique to its nature as a probabilistic technical indicator.
Interpretation bias
Identifying a wave on a drawing is much easier than identifying one on a stock chart. What seems like a clear wave to one person will be completely random movements to another.
This interpretation bias means that identifying waves is a subjective affair. Like all trading techniques, wave theory requires time and practice to wield effectively.
Limited predictive powers
Wave theory is a probabilistic tool, which means it can only offer the likelihood of an event occurring. This is in contrast to certain technical tools which are much more precise.
It’s important that wave traders factor this into their risk management. One effective way to do this is by risking a certain amount of your portfolio on each trade and using backup indicators to confirm wave theory analysis.
Wave failure
Finally, there is the possibility of wave failure occurring.
In essence, wave failure occurs when a wave does not materialize as expected or does not have the anticipated effects that wave theory says it should. Wave failure can happen for a number of reasons, including unforeseen market events or a rapid shift in sentiment.
Wave failure can be difficult to predict, which is an additional incentive to build sound risk management techniques into your trading strategy.
Conclusion
Wave theory is a powerful framework for understanding financial markets that roots market movements in investor sentiment.
The theory is relatively unique compared to other technical indicators in its probabilistic approach and connection to nature. While these aspects of the theory have been the subject of both praise and derision, many traders find wave theory to be a great addition to their trading arsenal.
Using wave theory first requires a sound understanding of basic wave patterns and principles. There is serious intellectual depth to the theory, with many researchers expanding on the work of Ralph Nelson Elliot. But for most traders, the basics should suffice to make a meaningful difference in trading strategies.
As with all other trading tools, though, risk management cannot be ignored. This is especially true due to the propensity for wave failure and the limited predictive powers associated with wave identification.
When combined with adequate risk management and other key indicators, though, wave theory can be an excellent tool in the hands of the right trader.
FAQ
What is an ABC correction?
An ABC correction is a specific type of wave pattern that reverses a previously bullish trend. It consists of a moderate A corrective wave, followed by a B impulsive wave which partially retraces the A wave, and results in a large C corrective wave that ends a positive trend.
What is a leading diagonal?
A leading diagonal is a type of impulsive wave that consists of five waves. Waves 2 and 4 are always corrective, while waves 1, 3, and 5 can be corrective or impulsive. They are considered the opposite of ending diagonals and are somewhat rare.
Is Elliot wave theory reliable?
Elliot wave theory can potentially be reliable if used with appropriate risk management and in coordination with other indicators. However, the theory does not have excellent predictive power, due to its probabilistic nature. In addition, there is always the potential for wave failures.
WeInvests is a financial portal-based research agency. We do our utmost best to offer reliable and unbiased information about crypto, finance, trading and stocks. However, we do not offer financial advice and users should always carry out their own research.
Read More