In this article, we will unravel the complexities of the Gann Theory, an innovative trading methodology created by renowned trader William Delbert Gann. Acclaimed worldwide, the Gann Theory intertwines elements of mathematics, geometry, and astronomy to form predictive techniques for market movements, capturing the interest of traders globally. We will start our exploration with a detailed look at the pivotal concepts of the Gann Theory, namely the ‘Square of 9’ and the ‘Gann Fan’. These techniques are integral to technical analysis, employed frequently for forecasting price changes and identifying key support and resistance levels.
As we journey through the intricacies of the Gann Theory, we aim to provide a comprehensive understanding of how these principles can be applied in practical trading scenarios. To do this, we will decode key terminologies like the ‘Gann Square of 9’, elucidate methodologies, and showcase practical examples. This article serves as a guide for all traders, whether novices or veterans, aiming to unlock the potential of the Gann Theory in their trading ventures. Through this in-depth exploration, we hope to equip you with a nuanced grasp of this challenging yet rewarding trading philosophy, empowering you to leverage its potential optimally.
What is Gann Theory?
The Gann Theory, first proposed by the influential trader W.D. Gann, forms a cornerstone in the world of technical analysis. Rooted in the principles of geometry, mathematics, and astronomy, this unique approach to market analysis and prediction has garnered global attention from traders. The key components of the Gann Theory include:
- Predictable, Cyclical Patterns: Gann postulated that markets operate in predictable, cyclical patterns that can be discerned and leveraged for trading. He believed that these patterns are fundamentally geometric and could be studied and charted.
- Gann Square of 9: A core concept of Gann’s methodology is the ‘Gann Square of 9’. It is essentially a circular number matrix that serves as the foundation for several techniques within Gann analysis. By arranging numbers in this circular chart, Gann sought to identify and exploit the market’s natural harmonic rhythms.
- Geometrically Structured Markets: The Gann Theory posits that markets, in their purest form, are geometrically structured and can be understood in terms of patterns, angles, and time. Gann believed that specific geometric shapes and angles held the key to predicting future price fluctuations, providing valuable insights for successful trading.
Gann’s emphasis on the use of angles for market analysis and his innovative concepts have left a lasting impact on the field of technical analysis, offering traders valuable tools to navigate the complexities of financial markets.
Breaking Down the Gann Square of 9
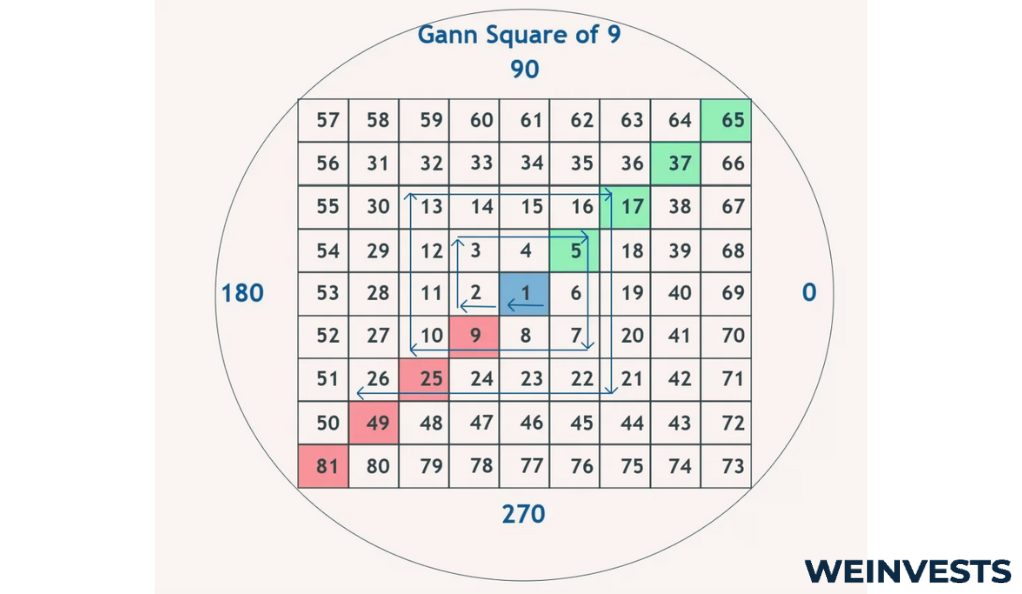
For traders new to the Gann Theory, one common question is, ‘What is the Square of Nine?’ The Square of Nine, or the Gann Square of 9, is a crucial tool within the Gann Theory for predicting potential price movements by identifying key levels of support and resistance. Here’s a breakdown of the Square of Nine and its significance:
- Spiral of Numbers: The Square of Nine is a spiral of numbers arranged in a way that every number is located at a 1-degree increment around a circle, starting from the center, which is the number one. This unique arrangement forms the foundation of Gann’s numerical analysis.
- Predicting Price Movements: Traders commonly use a Gann calculator, an easily accessible online tool, to calculate price levels based on the principles of the Gann Square of 9. By interpreting the numerical relationships within this square, traders can identify harmonic patterns that may indicate critical turning points in the market.
- Identifying Support and Resistance Levels: The Gann Square of 9 helps traders identify key levels of support and resistance in the market. These levels are considered significant because they are derived from the spiral of numbers, revealing potential price levels where the market might experience a change in direction.
- Harmonic Patterns: Gann’s approach to the Square of Nine involves analyzing harmonic patterns that occur within the numerical relationships. These patterns are believed to have predictive power and can assist traders in making informed decisions about potential market movements.
The Gann Square of 9 is a powerful tool that adds a geometric and mathematical dimension to the Gann Theory, enabling traders to uncover valuable insights into price action and identify potential trading opportunities.
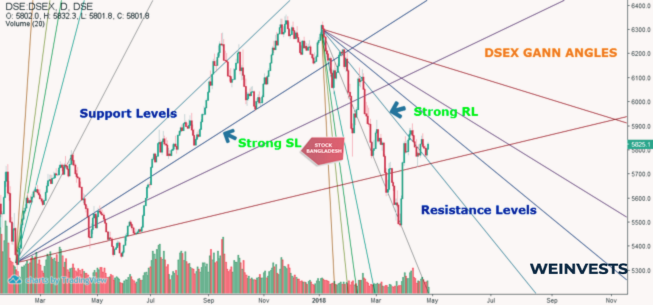
Utilizing the Gann Fan in Trading
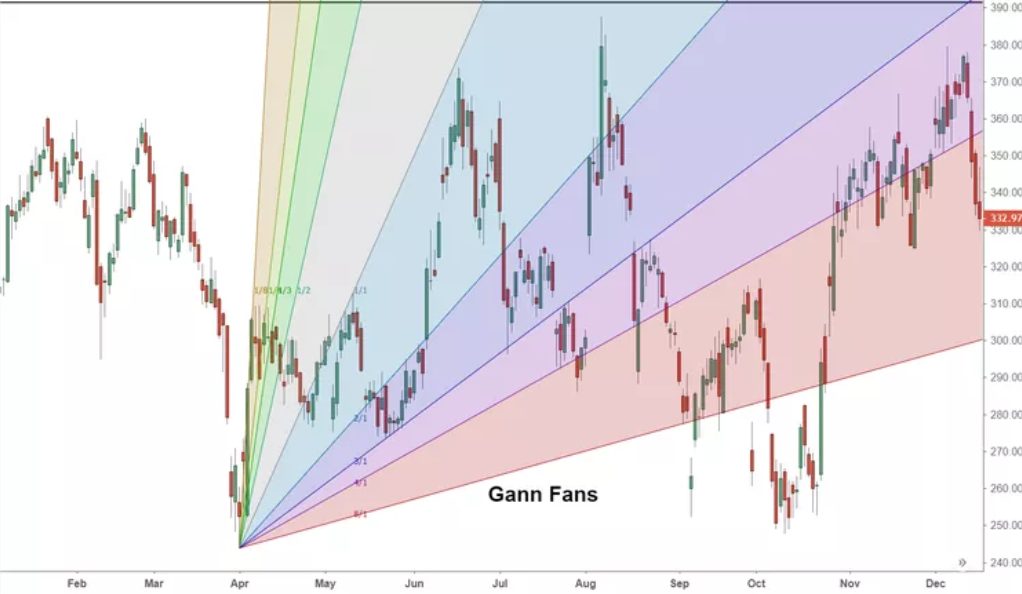
The Gann Fan is another core concept in the Gann Theory, serving as a predictive tool to anticipate potential market movements. It is a line-drawing tool that utilizes angles to show potential support and resistance lines and forecast potential price movements. The key elements of the Gann Fan include:
- Gann Angles: The Gann Fan consists of a series of diagonal lines called Gann angles. The most important angle is the 1×1 angle, which is drawn from a significant price point on the chart and represents a market moving one unit of price for each unit of time. This angle is said to depict a perfect balance between time and price.
- Derived Angles: Other angles are derived from the initial 1×1 line, each representing a different ratio of price to time. For example, the 2×1 Gann angle moves two units of price for one unit of time, and so on. These angles project potential support and resistance levels into the future, aiding in the identification of critical price levels.
- Application on Price Chart: Applying the Gann Fan involves identifying a significant swing high or swing low on the price chart and drawing the Gann angles from that point. The diagonal lines intersecting with price action on the chart are considered potential market turning points. These intersections serve as points of interest for traders, providing insights into possible price reversals or continuation patterns.
The Gann Fan’s concept of ‘balance’ between price and time allows traders to gauge potential support and resistance levels, aiding in the prediction of future price movements. However, it is essential to combine the Gann Fan with other technical analysis tools and risk management strategies for a comprehensive trading approach.
Real-life Examples of Gann Theory Trades
The practical examples of the Gann Fan in action illustrate the power of the Gann Theory and its trading strategy:
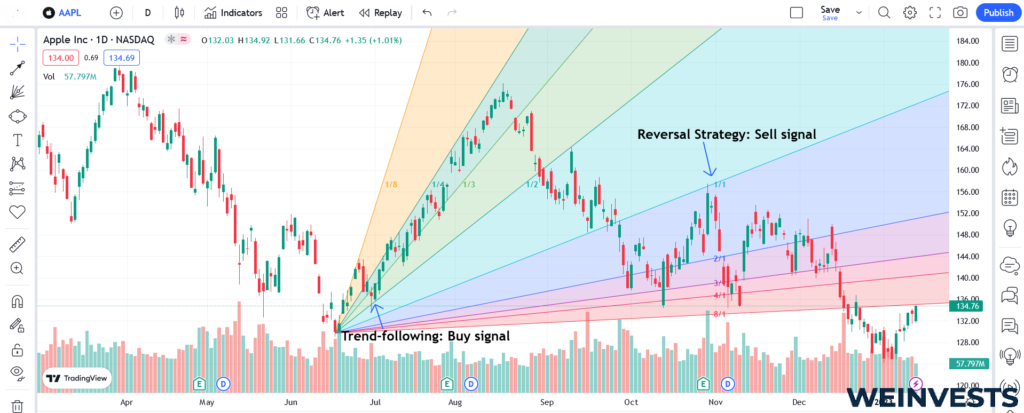
Example 1: NASDAQ
- In November 2021, the NASDAQ was at an all-time high, and a perfect 45-degree angle (1/1 line) was drawn from this peak using the Gann Fan tool.
- As the bearish market developed in the subsequent months, the 1/1 line was adjusted to align with the peaks during this downtrend.
- In February 2023, there was a significant upward break of the 1/1 line, signaling a potential reversal of the previous bearish trend according to the Gann fan trading strategy.
- The break led to the confirmation of a new bullish phase, and the NASDAQ started an upward rally.
- The next step in the Gann fan strategy required waiting for an upward break of the 2/1 Gann angle before initiating a buying action.
- The placement of a protective stop-loss order took place just below the swing low preceding the 2/1 Gann angle breakout, providing a safety net in case of an unexpected market downturn.
- Throughout the following months, the NASDAQ experienced a steady rally, closely observed with the help of the Gann fan indicator, leading to a potential attempt to break a new all-time high in June and July 2023.
Example 2: Copper
- In March 2020, during the COVID-19 pandemic, Copper hit a low, and a Gann Fan was initiated from this point.
- Copper experienced a significant rally, reaching a high point in March 2021.
- After reaching the high, Copper faced a downturn and intersected with the 1/1 line of the Gann Fan, finding some short-lived support.
- However, the support at the 1/1 line did not hold for long, and Copper broke through this crucial Gann line, leading to further price decline until it hit the 2/1 line of the Gann Fan, where support was found again.
- Copper then began to rally, moving close to the 1/1 line again, but soon retraced its steps, returning to the 2/1 line.
- This repeated interaction with the 2/1 line, following the initial break of the 1/1 line, confirmed the bearish trend reversal originally signaled by the breach of the 1/1 line, in line with Gann’s principles.
- By following the Gann fan rules and observing the intersection of price with different Gann lines, traders could have identified the trend reversal and made informed decisions based on these trends, highlighting the usefulness of Gann’s principles in understanding and predicting market trends.
In conclusion, the practical examples demonstrate the effectiveness of the Gann Fan in predicting potential market movements, identifying support and resistance levels, and signaling trend reversals. The Gann Theory, with its focus on geometry and angles, provides traders with a unique approach to market analysis and enhances their ability to make informed trading decisions.
Risks and Limitations of Gann Theory

The Gann Theory, like any trading strategy, comes with its own set of risks, limitations, and considerations that traders must be aware of:
1. Predictability of Market Cycles: The Gann Theory assumes the predictability of market cycles and the existence of geometric patterns. While this idea forms the basis of Gann’s approach, it may not always accurately reflect the complexities and unpredictability of market dynamics. External factors, such as economic indicators, political events, global crises, and investor sentiment, can disrupt seemingly predictable patterns, leading to unexpected market movements and potential losses for traders.
2. Complexity and Learning Curve: The Gann Theory’s inherent complexity can pose significant challenges for traders, especially those new to technical analysis. Understanding advanced mathematics and geometry is essential to interpret Gann angles and the Square of 9 accurately. Misinterpretations or inaccuracies in applying these techniques can lead to erroneous predictions and potential trading mistakes. Therefore, the Gann Theory may not be suitable for all traders, particularly those unwilling or unable to invest the time required to master its intricacies.
3. Complementing with Other Strategies: Relying solely on the Gann Theory or any single trading strategy is risky. No single approach can provide a complete picture of the markets or guarantee success. The Gann Theory is more effective when used in conjunction with other technical analysis techniques, fundamental analysis, and, most importantly, robust risk management principles. A diversified approach can offer a more balanced perspective, enhancing trading decisions and mitigating potential risks.
4. Uncertainty and Risk: Like all trading strategies, the Gann Theory doesn’t provide certainties. Markets can behave unpredictably, and price movements may not always align with Gann’s predictions. Traders should approach the Gann Theory with a clear understanding of its limitations and be prepared to adapt to changing market conditions. Strict adherence to risk management principles is essential for managing potential losses.
In conclusion, while the Gann Theory offers intriguing insights into market behavior and has its loyal proponents, traders must be aware of its limitations and the inherent risks associated with trading. It requires a deep understanding of the theory, discipline in its application, and a comprehensive approach to trading that incorporates other analytical methods and risk management strategies. Successful trading involves a balance of knowledge, experience, and adaptability to navigate the complexities of financial markets effectively.
Final Thoughts
The Gann Theory, with its innovative concepts like the Gann Fan and the Square of 9, provides a distinct approach to understanding and predicting market behavior. While the theory’s complexity can be challenging, its potential to pinpoint significant market turning points makes it an exciting tool for many traders.
As we continue to explore and develop new trading tools and strategies, the principles of the Gann Theory are likely to remain an important part of the trader’s toolbox. However, it is crucial to remember that no theory guarantees success in trading. Risk management and a well-rounded approach that uses multiple techniques are essential for long-term success in the financial markets.
The future implications of the Gann Theory are tied to advances in technology, which could potentially simplify its use and increase its accessibility for traders. As we continue our journey in the world of trading, the understanding and application of the Gann Theory are bound to evolve, presenting fascinating prospects for the future.
FAQ
What is the Gann Theory in trading?
The Gann Theory is a unique approach to trading developed by the renowned trader, William Delbert Gann. It combines elements of mathematics, geometry, and astronomy to predict market movements. The Gann Theory posits that markets operate in predictable, cyclical patterns that can be discerned and leveraged for trading, using tools such as the ‘Square of 9’ and the ‘Gann Fan’.
What are the ‘Square of 9’ and the ‘Gann Fan’ in Gann Theory?
The ‘Square of 9’ and the ‘Gann Fan’ are two central concepts within the Gann Theory. The ‘Square of 9’ is a circular number sequence that is used to predict future price movements by finding natural resistance and support levels. The ‘Gann Fan’, on the other hand, is a line-drawing tool that utilizes angles to forecast potential price movements and show potential support and resistance lines.
Are there any limitations or risks in using the Gann Theory?
While the Gann Theory offers unique insights into market behavior, it does come with certain limitations and risks. Its assumptions of market predictability may not always hold true due to various external influences, such as economic events, political changes, and shifts in investor sentiment. Additionally, the complexity of Gann’s techniques, such as interpreting the ‘Square of 9’ and ‘Gann Fan’, may pose a challenge to many traders. It’s important to use the Gann Theory alongside other trading strategies and risk management principles for a more balanced trading approach.
WeInvests is a financial portal-based research agency. We do our utmost best to offer reliable and unbiased information about crypto, finance, trading and stocks. However, we do not offer financial advice and users should always carry out their own research.
Read More