Trading in financial markets can be a thrilling endeavor, full of both risks and rewards. One of the ways traders try to minimize their risk and optimize their reward is through the use of trading patterns. Trading patterns, such as the head and shoulders pattern, provide a roadmap for traders to understand market behavior, forecast future price movements, and make strategic trading decisions.
This article aims to introduce the head and shoulders pattern, its inverse or inverted counterpart, and its variations such as the ‘H’ pattern, in the context of trading. We will dive into the theory behind these patterns, demonstrate how to identify them on trading charts, and provide practical examples of their application. In addition, the discussion will encompass strategies, techniques, methodologies, risks, limitations, and key considerations associated with these patterns.
1. Explanation of The Head and Shoulders Pattern
The head and shoulders pattern, along with its inverse counterpart and the ‘H’ pattern, are essential elements of technical analysis in trading. Here’s a breakdown of each pattern:
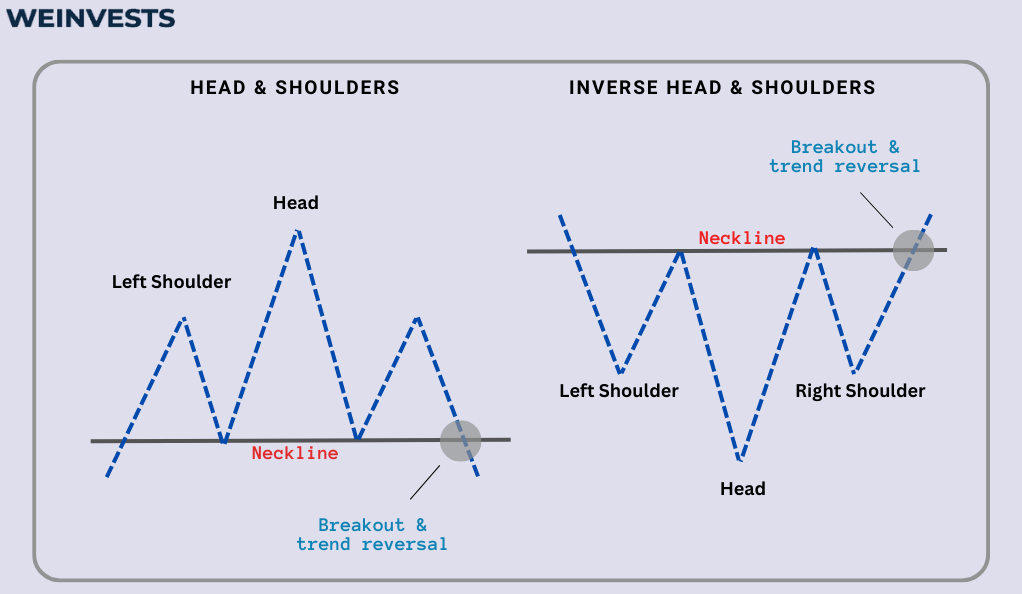
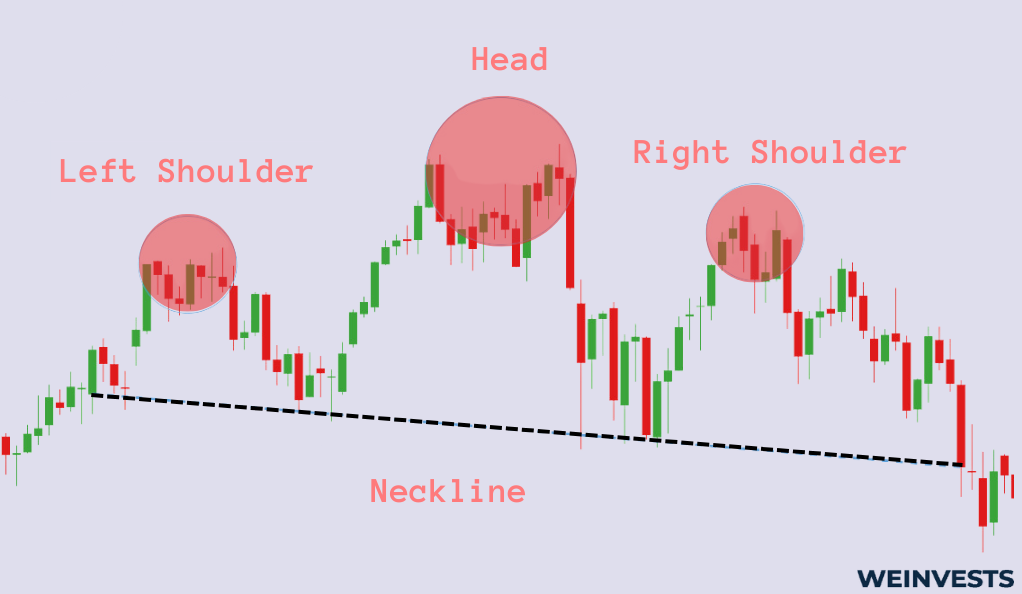
- Head and Shoulders Pattern: This pattern is a strong indicator of a trend reversal in technical analysis. It appears in price charts as three distinct peaks or “price highs,” resembling a person standing straight. The centre peak is called the “head,” which is taller and protrudes above the two “shoulders” (left and right peaks). The two shoulders are roughly equal in height and flank the head on either side. A critical feature of this pattern is the “neckline,” a support line drawn by connecting the low points following the creation of each shoulder. The pattern is confirmed when the price drops below the neckline after the formation of the right shoulder.
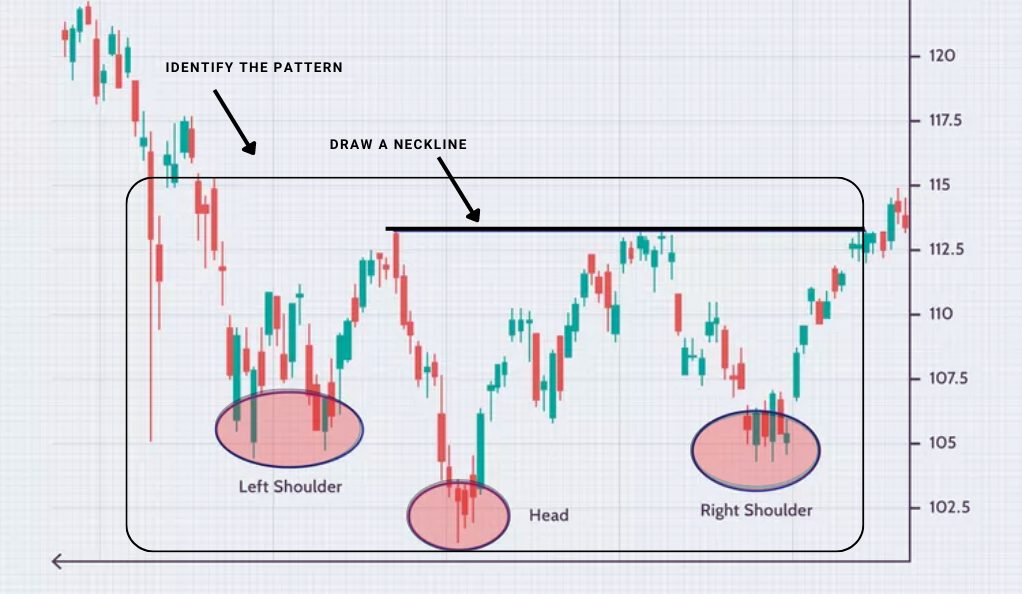
- Inverse or Inverted Head and Shoulders Pattern: This bullish pattern is the inverse of the head and shoulders pattern. It signals a trend reversal in a previously bearish market. In this case, the head becomes the lowest point, and the shoulders are higher. The neckline now acts as a resistance line. The pattern is confirmed when the price breaks through the neckline following the completion of the right shoulder.
- ‘H’ Pattern: The ‘H’ pattern is a variation of the head and shoulders pattern, but it lacks a fully formed right shoulder. This characteristic gives it the name ‘H’ pattern. Unlike its counterparts, the ‘H’ pattern does not indicate a trend reversal. Instead, it forecasts the continuation of an ongoing trend.
In short, these patterns are powerful tools for traders to identify potential trend reversals and continuations in the market. The head and shoulders pattern suggests a bearish reversal, while its inverse counterpart signals a bullish reversal. On the other hand, the ‘H’ pattern indicates the continuation of the prevailing trend. Traders use these patterns in combination with other technical indicators and strategies to make informed trading decisions.
2. Head and Shoulder Pattern: Key Concepts
Discerning head and shoulders patterns, as well as their variations, is a skill that requires an understanding of key trading concepts, particularly the principles of support and resistance levels. Here’s a breakdown of how these patterns work and how traders utilize them strategically:
- Neckline as Support and Resistance: In the context of head and shoulders patterns, the neckline serves as either a support level (for the traditional head and shoulders) or a resistance level (for the inverse head and shoulders). In a traditional head and shoulders pattern, the neckline is a support line that holds the price from moving lower. Conversely, in an inverse head and shoulders pattern, the neckline acts as a resistance line that prevents the price from moving higher.
- Identifying Breakouts: For both patterns, the most critical point is the breakout of the neckline. In a head and shoulders pattern, when the price breaks below the neckline following the formation of the right shoulder, it indicates that the support level has been breached, signaling a potential bearish trend reversal. On the other hand, in an inverse head and shoulders pattern, when the price breaks above the neckline after the formation of the right shoulder, it indicates that the resistance level has been overcome, signaling a potential bullish reversal.
- Entry and Exit Points: Traders use these patterns to pinpoint potential entry and exit points for their trades. The ideal entry point is typically at the breakout of the neckline. Once the breakout occurs, traders may enter a position in the direction of the pattern’s expected reversal. Additionally, the projected price target, often referred to as the “target head and shoulders,” is determined by measuring the distance from the top of the head to the neckline in the head and shoulders pattern (or from the bottom of the head to the neckline in the inverse pattern). This distance is then projected downward from the neckline break in the case of a head and shoulders pattern or upward in the case of an inverse pattern. This projected distance provides a potential exit point or profit target for traders.
- Maximizing Profitability and Managing Risk: Identifying these target points is crucial for traders to maximize profitability and manage risk effectively. Having a clear profit target helps traders decide when to close their positions and secure their gains. Additionally, setting stop-loss orders below the neckline (for head and shoulders) or above the neckline (for inverse head and shoulders) helps limit potential losses if the trade doesn’t go as expected.
Understanding support and resistance levels, as well as the significance of neckline breakouts, is vital for effectively trading head and shoulders patterns. Traders utilize these patterns strategically to identify potential entry and exit points, project price targets, and manage risk in their trades.
3. How to Trade the Head and Shoulders Pattern
Trading the head and shoulders pattern, like any strategic technical analysis, follows a systematic approach. Here’s a step-by-step breakdown of how traders can effectively trade this pattern:
The process begins with identifying the head and shoulders pattern on the price chart. Traders look for three distinct peaks in the formation—the head standing taller than two approximately equal-height shoulders. These unique characteristics make the pattern relatively easy to spot amidst other price movements.
Once the pattern is identified, traders draw the neckline, a vital component of the pattern. For the head and shoulders pattern, the neckline is created by connecting the two lowest points of price movement following the first and second peaks (the left shoulder and the head). The neckline represents the support level that the price has been respecting during the pattern formation.
Careful monitoring of price action becomes the next crucial step. Traders need to pay close attention to how the price behaves after the formation of the right shoulder. In the case of a standard head and shoulders pattern, if the price breaks below the neckline, it confirms the pattern. This downward break in the neckline is a pivotal point and often prompts traders to place a sell order, anticipating an incoming bearish trend.
The process for the inverse head and shoulders pattern is similar to the traditional pattern but in reverse. For this pattern, the neckline, representing resistance, is drawn by connecting the two highest points of price following the formation of the head and the left shoulder. Again, traders need to closely monitor the price action. Once the right shoulder is formed, if the price breaks above the neckline, it validates the inverse pattern. This upward break prompts traders to place a buy order, as it forecasts a bullish reversal in a previously bearish market.
To briefly summarize, trading the head and shoulders pattern requires a systematic approach. Traders begin by identifying the pattern and drawing the neckline. They then closely observe the price movement, waiting for the crucial breakout above or below the neckline to confirm the pattern’s validity. By following this methodical process, traders can capitalize on potential trend reversals and make informed trading decisions.
4. Real-life Examples of the Head and Shoulders Pattern
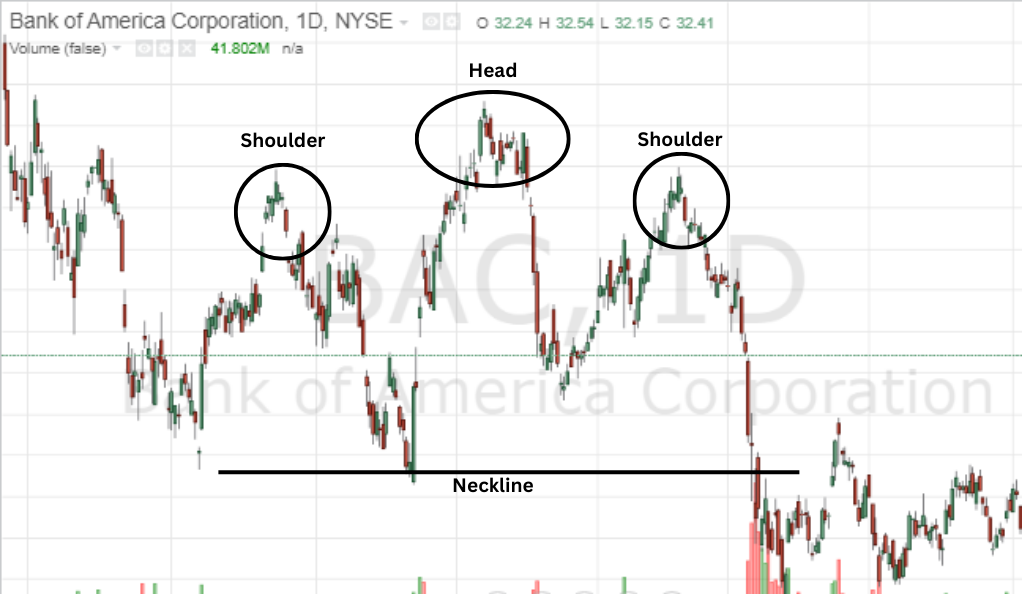
In the examples provided, we can see two clear instances of the head and shoulders pattern, one in Bank of America’s (BAC) stock and the other in the S&P 500 index. Let’s break down each example:
Bank of America (BAC) Stock:
- The pattern began with an initial rally, forming the peak of the left shoulder, driven by positive investor sentiment and high buying pressure.
- This rally was followed by a correction period where the price dipped significantly, matching the low at the start of the left shoulder.
- Another resurgence in optimism led to a second rally, creating an even higher peak, which served as the head of the pattern.
- However, the head’s peak was short-lived as investor sentiment began to shift.
- By February 2023, the price retraced to form a slightly higher low than the previous two dips, indicating the formation of the right shoulder and a more cautious sentiment among investors.
- The completion of the head and shoulders pattern was confirmed in March 2023 when the price broke below the neckline and continued to drop, signifying a bearish market reversal.
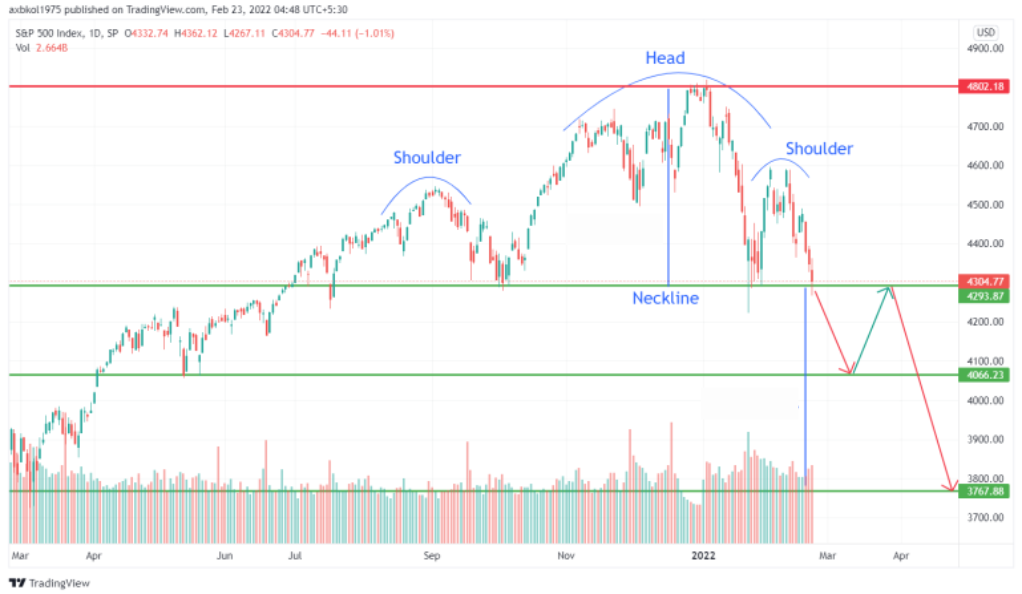
S&P 500 Index:
- The pattern in the S&P 500 index started with an upward trajectory, rallying to a short-term high, driven by positive market dynamics and possibly end-of-year investment strategies.
- This rally was followed by a retracement, nearly matching the previous low, which reflected a market correction as investors took profits and adjusted their positions.
- Despite the retracement, the S&P 500 managed to surge to a new high, forming the head of the pattern, indicating temporary optimism among investors.
- As the new year began, the index fell to about the middle of its range, indicating the onset of investor caution.
- A short-lived rally formed the right shoulder, but the S&P 500 failed to make a new high.
- By the end of January 2023, the index fell significantly, breaking the neckline and signaling a bearish market reversal.
- The trend continued even lower in the following months, confirming the completion of the head and shoulders pattern and illustrating the market’s transition from optimism to caution and, finally, to a more bearish sentiment.
In both examples, the head and shoulders pattern exhibited a bearish trend reversal. The pattern’s formation and subsequent confirmation through the break of the neckline indicated a shift in investor sentiment from bullish to bearish, leading to potential opportunities for traders to make informed trading decisions.
5. Potential Risks of Head and Shoulders Pattern
While the head and shoulders patterns can provide meaningful insights into market trends, traders must be aware of the risks and limitations associated with these patterns. Here are the key considerations:
One of the most significant risks is the occurrence of false signals. Sometimes, price movements may appear to be forming a head and shoulders or an inverse head and shoulders pattern, but they turn out to be random price fluctuations, leading traders to make misguided decisions.
Even after pattern confirmation, where the price breaks the neckline, there’s no guarantee of a successful trade. There is a risk that the price could reverse its direction after breaking the neckline, resulting in a trade that ends in a loss. This phenomenon is often referred to as a “throwback” or a “pullback.”
The reliability of head and shoulders patterns can vary based on the timeframe. These patterns are generally considered more reliable and significant on longer timeframes, such as daily or weekly charts. On shorter timeframes like 1-minute or 5-minute charts, the patterns may be less accurate due to increased market noise and volatility.
While pattern recognition is a potent tool, it should not be the sole factor guiding trading decisions. Considering other elements, such as market conditions, fundamental analysis, economic indicators, and other technical analysis tools, provides a more holistic view of the market. This balanced approach reduces the likelihood of basing trades on misleading signals and promotes more informed and strategic trading decisions.
In conclusion, traders should approach head and shoulders patterns with caution and a critical mindset. While these patterns can offer valuable insights, they are not foolproof and carry inherent risks. Understanding the limitations of the patterns and incorporating other analytical tools can lead to a more comprehensive and effective trading strategy.
Final Thoughts
Trading using the head and shoulders patterns, including their inverse and ‘H’ variants, can be a game-changer in a trader’s arsenal. However, understanding their nuances, identifying them correctly, and using them in conjunction with other technical analysis tools and market information is vital for success. While they offer an intriguing peek into possible future market movements, they are not devoid of risks and limitations. As with any trading strategy, prudent risk management, including setting stop losses and take profit levels, is crucial.
The head and shoulders patterns continue to be relevant in an ever-evolving market, further reinforcing the timelessness of chart patterns in financial trading.
FAQ
What does a head and shoulders pattern signify in trading?
A head and shoulders pattern is a reliable technical analysis chart pattern that often signals a reversal in the trend. It typically indicates a shift from a bullish (upward) trend to a bearish (downward) trend. This pattern is characterized by three peaks, with the middle peak (head) being the highest and the two other peaks (shoulders) being lower and roughly equal to each other.
How can I identify a head and shoulders pattern?
To identify a head and shoulders pattern, you’ll need to look for three distinct peaks on a price chart. The first peak is the left shoulder, followed by a higher peak known as the head, and then a third peak, the right shoulder, that’s similar in height to the left shoulder. These peaks are separated by lows, which form what is known as the “neckline”. The pattern is confirmed when the price falls below the neckline after forming the right shoulder.
Can a head and shoulders pattern be used for bullish trends?
Yes, the head and shoulders pattern has an inverse version known as the inverse or reverse head and shoulders pattern. This pattern is typically seen at the end of a downward trend and can signal a reversal to an upward, or bullish, trend. It is identified by three troughs, with the middle one (head) being the deepest and the other two (shoulders) being shallower and roughly equal to each other. The pattern is confirmed when the price rises above the neckline after forming the right shoulder.
WeInvests is a financial portal-based research agency. We do our utmost best to offer reliable and unbiased information about crypto, finance, trading and stocks. However, we do not offer financial advice and users should always carry out their own research.
Read More