


Volume Price Analysis is a methodology used in trading that combines the study of volume and price movements to gain insights into market dynamics.
It is based on the principle that volume – the number of shares or contracts traded – plays a crucial role in determining the strength and sustainability of price movements; therefore, by examining the relationship between volume and price, traders can identify significant trends, reversals, and potential market turning points.
Understanding the importance of volume and price is essential because the first one reflects market participation and provides confirmation or divergence signals for price movements. By incorporating this methodology, traders can make more informed decisions and enhance their trading strategies.
The Relationship Between Volume and Price
Volume and price are two fundamental components in financial markets, and their interplay provides valuable insights into market dynamics. Exploring the relationship between volume and price can help traders understand the underlying forces driving market movements.
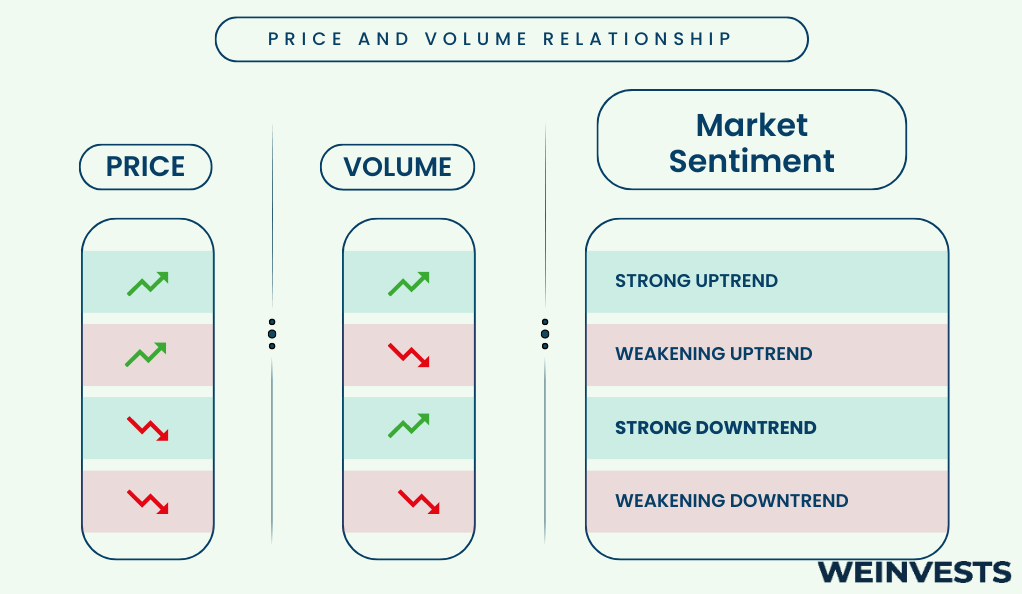
Volume plays a crucial role in price movements. When volume accompanies price changes, it signifies the presence of market participants actively buying or selling assets: high volume during price advances suggests strong buying interest, indicating a potentially bullish trend; conversely, high volume during price declines indicates selling pressure and a possible bearish trend. Low volume during price movements, on the other hand, may indicate a lack of conviction and could suggest a period of consolidation or indecision in the market.
Examining case studies can illustrate the dynamics between volume and price. For instance, a scenario where prices rise sharply on high volume indicates validates the upward move. Similarly, if prices decline significantly with high volume, it confirms the bearish sentiment and reinforces the downtrend.
However, it is important to note that volume alone cannot predict price movements. To form a comprehensive trading strategy, a trader should analyze price patterns, support and resistance levels, and other technical indicators. Furthermore, volume can provide confirmation or divergence signals, where price movements are supported or contradicted by corresponding volume patterns, indicating potential trend reversals or continuation.
In summary, understanding the relationship between volume and price is essential for traders. Volume provides insights into market participation, strength, and confirmation of price movements. By incorporating volume analysis into their trading strategies, traders can gain a deeper understanding of market dynamics and make more informed decisions.
Tools and Techniques
Volume Price Analysis employs various tools and techniques to analyze the relationship between volume and price movements. These tools help traders gain deeper insights into market dynamics and make informed trading decisions.

Moving Averages
One commonly used tool is moving averages. Moving averages smooth out price data over a specified period, allowing traders to identify trends and potential support or resistance levels. When combined with volume, moving averages can provide additional confirmation signals. For example, if prices are above a rising moving average and accompanied by increasing volume, it suggests a bullish trend. Conversely, if prices are below a declining moving average with rising volume, it indicates a potential bearish trend.
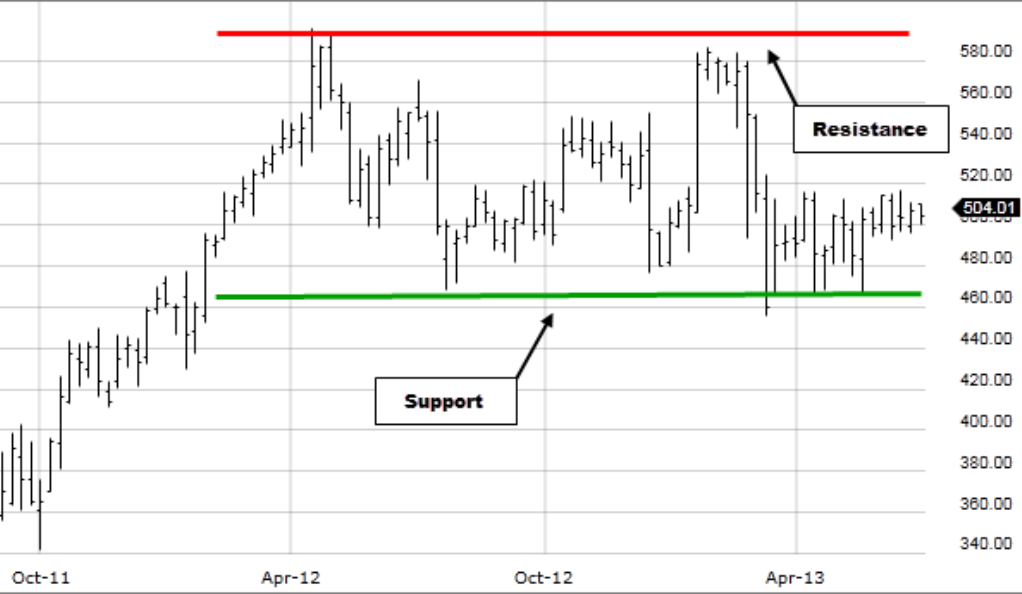
Support and Resistance Levels
Support and resistance levels also play a significant role. These levels are areas on a price chart where buying or selling pressure is historically strong. When volume confirms support or resistance levels, it strengthens their significance. For instance, if prices bounce off a support level on high volume, it suggests that buyers are stepping in. Similarly, if prices fail to break through a resistance level despite high volume, it indicates strong selling pressure
Analysis of Volume Patterns
Another technique used is the analysis of volume patterns. Volume patterns can reveal valuable information about market sentiment and potential price reversals. For example, an increase in volume after a prolonged price decline may indicate capitulation, signaling a possible trend reversal. Similarly, a decreasing volume during an uptrend could suggest waning buying interest, potentially leading to a market correction.
Divergence Analysis
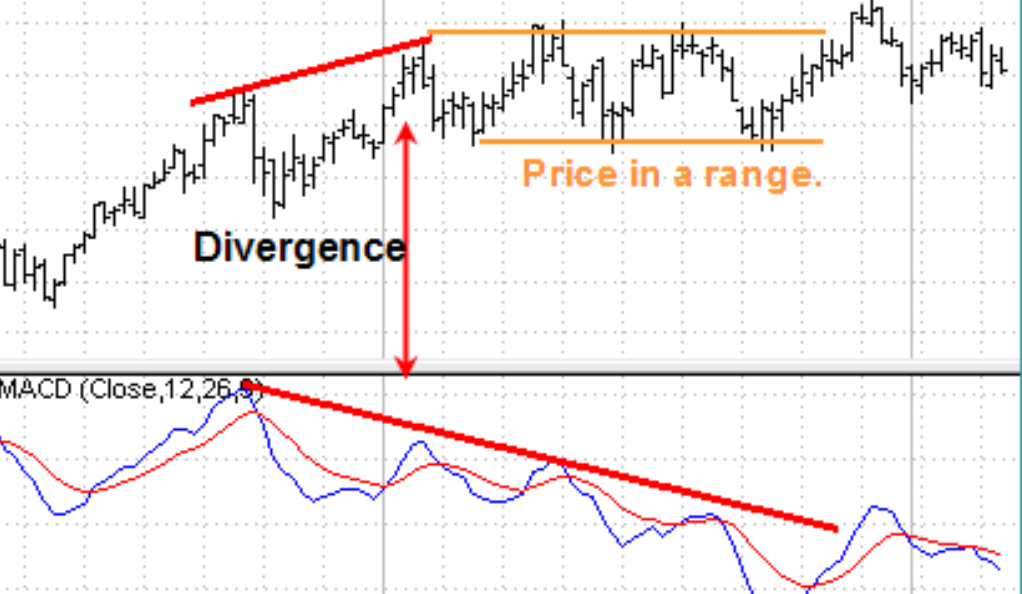
Furthermore, divergence analysis is a powerful technique. Divergence occurs when price and volume move in opposite directions. For example, if prices are making higher highs, but volume is decreasing, it suggests weakening momentum and a potential trend reversal. Conversely, if prices are making lower lows, but volume is increasing, it could indicate underlying strength and a possible trend continuation.
To effectively utilize these tools and techniques, traders often combine them with other technical indicators, such as oscillators, trend lines, or chart patterns. This holistic approach helps traders validate signals, identify potential entry or exit points, and manage risk.
In conclusion, Volume Price Analysis offers traders valuable insights into market dynamics by examining the interplay between volume and price movements. Tools like moving averages, support and resistance levels, volume patterns, and divergence analysis enhance the understanding of this relationship.
Applying Volume Price Analysis in Trading Strategies
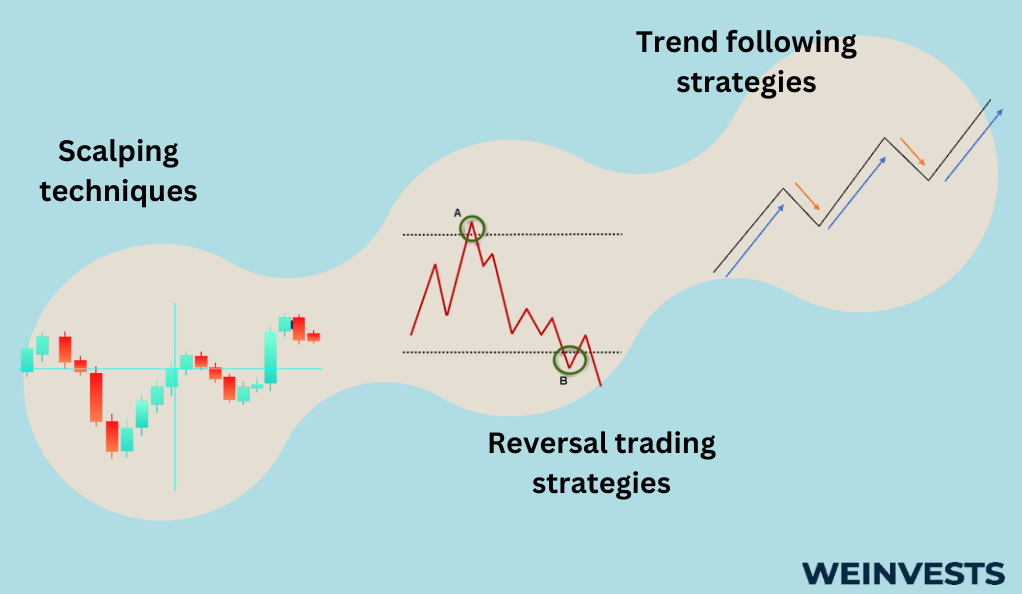
Volume Price Analysis can be applied to various trading strategies, providing traders with valuable insights for trend following, reversal trading, and scalping techniques.
Trend following strategies
Incorporating volume price analysis in trend following strategies can enhance trading decisions. Traders can look for high-volume breakouts in the direction of the trend as confirmation signals. For example, if prices are trending upward, a breakout with high volume suggests a continuation of the bullish trend, providing an opportunity to enter or add to existing positions. Similarly, during a downtrend, a breakdown with high volume confirms the bearish sentiment, indicating a potential opportunity to enter short positions.
Reversal trading strategies
Volume price analysis is also useful for reversal trading strategies. Traders can monitor volume patterns to identify potential trend reversals. For instance, if prices are making lower lows while volume decreases, it may indicate a weakening bearish trend and a potential reversal. In such cases, traders can wait for a volume surge accompanied by a price reversal pattern to enter counter-trend trades. This approach helps traders catch early signs of trend exhaustion and capitalize on trend reversals.
Scalping techniques
Scalping techniques can also benefit from this methodology. Scalpers aim to profit from small price movements within a short time frame. By incorporating volume analysis, scalpers can identify rapid shifts in buying or selling pressure. High volume accompanied by quick price changes suggests strong momentum, providing potential scalping opportunities. Scalpers can use volume indicators to confirm the strength of their chosen scalping setups and manage their trades more effectively.
However, it’s essential to exercise caution and practice risk management when applying volume price analysis. Like any trading strategy, it is not foolproof and may produce false signals or misinterpretations. Traders should combine their analysis with proper risk management techniques, such as setting stop-loss orders and maintaining a disciplined approach to trading.
In summary, volume price analysis can be a valuable tool for various trading strategies. Whether it’s trend following, reversal trading, or scalping, incorporating volume analysis helps traders make more informed decisions and increase the effectiveness of their trading strategies.
Advanced Concepts
Volume Price Analysis encompasses advanced concepts that further enhance the understanding of market dynamics. Let’s explore a few of these concepts: applying volume profile analysis, interpreting volume price divergence, and utilizing various indicators and oscillators.
Volume profile analysis is a technique that provides insights into the distribution of volume at different price levels. It helps traders identify significant price levels where high trading activity has occurred. By examining the volume profile, traders can identify areas of support and resistance, as well as potential price targets. This information can assist in formulating trading strategies based on the areas of high volume concentration.
Interpreting volume price divergence involves analyzing the relationship between volume and price movements when they are moving in opposite directions. Divergence occurs when prices are making new highs or lows, but volume is not confirming the move. This can signal a potential reversal or weakening of the current trend. Traders can use this divergence as a warning sign to exercise caution and consider potential trade exits or reversals.
Volume-based indicators and oscillators are another set of tools used in advanced volume price analysis. These indicators are designed to provide insights into volume trends, momentum, and market sentiment. Examples of volume-based indicators include On-Balance Volume (OBV), Chaikin Money Flow (CMF), and Volume Weighted Average Price (VWAP). These indicators can assist traders in confirming price movements, identifying overbought or oversold conditions, and generating trading signals based on volume patterns.
It’s important to note that advanced concepts in volume price analysis require experience and careful interpretation. Traders should understand the underlying principles of these concepts and practice using them in conjunction with other technical analysis tools. Additionally, risk management should always be considered when applying advanced concepts to trading strategies.
By incorporating these concepts, traders can gain insights into market behavior and identify potential opportunities. However, continuous learning and adaptability are key to staying updated with evolving market conditions and refining volume price analysis techniques.
Integrating Volume Price Analysis with Other Technical Analysis Tools
Volume Price Analysis can be a powerful tool on its own, but integrating it with other tools enhances its effectiveness. Let’s explore how to combine volume price analysis \with chart patterns, Fibonacci retracements, and candlestick patterns.
Combining volume price analysis with chart patterns allows traders to validate and strengthen their trading signals. For example, if a bullish chart pattern, such as a double bottom, is accompanied by high volume on the breakout, it adds confirmation to the pattern and increases the likelihood of a successful trade. Conversely, if a bearish chart pattern, like a head and shoulders pattern, forms with increasing volume on the breakdown, it reinforces the bearish sentiment.
Using volume price analysis with Fibonacci retracements can provide additional insights into potential support and resistance levels. When a retracement level coincides with a significant volume area, it strengthens the importance of that level. If prices bounce off a Fibonacci level with high volume, it confirms the significance of the retracement level and supports the idea of a trend continuation.
Incorporating volume analysis in candlestick patterns can offer valuable confirmation signals. For instance, if a bullish engulfing pattern occurs with high volume, it suggests strong buying pressure and validates the bullish signal. On the other hand, if a bearish engulfing pattern forms with high volume, it confirms the bearish sentiment and reinforces the sell signal.
It’s important to remember that while integrating volume price analysis with other technical analysis tools can enhance trading decisions, it should be done with proper analysis and interpretation. Traders should also consider market conditions, overall trend, and risk management principles when making trading decisions.
By combining volume price analysis with other technical analysis tools, traders can gain a more comprehensive understanding of market dynamics. This integration allows for stronger confirmation signals, better-defined support and resistance levels, and improved timing of entry and exit points. However, continuous learning and practice are crucial for mastering the integration of these tools and adapting to changing market conditions.
Case Studies: Real-world Examples
Volume Price Analysis is a versatile methodology that can be applied to various financial markets. Let’s explore some real-world examples of its application in stock markets, cryptocurrencies, and forex markets.
Analyzing volume price patterns in stock markets can provide valuable insights for traders. For example, during an uptrend, if prices continue to rise on increasing volume, it suggests strong buying interest and validates the bullish trend. On the other hand, if prices decline on high volume during an uptrend, it may indicate profit-taking or distribution by institutional investors, potentially signaling a trend reversal. By studying volume price patterns in combination with other technical analysis tools, traders can make more informed decisions regarding entry and exit points.
Volume price analysis has also gained popularity in the realm of cryptocurrencies. In this volatile market, analyzing volume can help identify trends, support and resistance levels, and potential market reversals. For instance, if a cryptocurrency experiences a surge in price with a significant increase in trading volume, it indicates strong buying pressure and validates the upward move. Conversely, if a cryptocurrency declines on high volume, it may suggest a loss of confidence and a potential trend reversal. By incorporating volume price analysis in cryptocurrency trading strategies, traders can better navigate this dynamic market.
In the forex markets, volume-based trading strategies can provide valuable insights into market sentiment and potential trend reversals. While forex is a decentralized market with no central exchange to track volume, traders often rely on volume-based indicators, such as tick volume or volume spread analysis. These indicators can help identify market participation, support and resistance levels, and potential breakout or reversal points. By combining volume analysis with other technical tools, such as trend lines or candlestick patterns, forex traders can enhance their decision-making process and improve their trading results.
It’s important to note that volume price analysis should be used in conjunction with other forms of analysis and risk management principles. Real-world case studies demonstrate the versatility of volume price analysis across different markets, enabling traders to make more informed trading decisions based on the interplay between volume and price movements.
Summary and Key Takeaways
Volume Price Analysis is a methodology that combines the study of volume and price movements to gain insights into market dynamics. By examining the relationship between volume and price, traders can identify trends, reversals, and potential market turning points.
Key Takeaways for implementing volume price analysis:
- Volume provides confirmation or divergence signals for price movements, indicating the strength and sustainability of trends.
- Incorporate volume price analysis in trend following strategies by looking for high-volume breakouts in the direction of the trend.
- Use volume analysis for reversal trading by monitoring volume patterns to identify potential trend reversals.
- Apply volume price analysis in scalping techniques by identifying rapid shifts in buying or selling pressure.
- Combine volume price analysis with othe tools, such as chart patterns, Fibonacci retracements, and candlestick patterns, for stronger confirmation signals.
- Continuously learn and adapt to evolving market conditions when applying volume price analysis.
- Exercise caution and practice proper risk management when interpreting volume price patterns and signals.
By integrating this methodology into trading strategies, traders can gain a deeper understanding of market dynamics, validate trading signals, and make more informed decisions. However, it is important to remember that it should be used in conjunction with other forms of analysis and risk management principles for a comprehensive trading approach. If you want to know more about this world, don’t forget to read “Top 5 trading strategies“.
Frequently Asked Questions (FAQs)
What is volume price analysis?
Volume price analysis is a methodology that analyzes the relationship between trading volume and price movements to gain insights into market dynamics, trends, and potential reversals.
How can volume price analysis help in trading decisions?
Volume price analysis provides confirmation signals, identifies market sentiment, and validates trading setups. It assists traders in making more informed decisions regarding entry and exit points, trend identification, and risk management.
Which indicators are commonly used?
Common indicators used include moving averages, support and resistance levels and volume-based oscillators.
How does volume affect price movements?
Volume reflects market participation and can influence price movements. High volume often confirms the strength of price trends, while divergence between volume and price can indicate potential reversals or weakening trends.
Can it be applied to different asset classes?
Yes, to various asset classes, including stocks, cryptocurrencies, forex, commodities, and more. The underlying principles remain consistent across different markets.
What are some advanced techniques in volume price analysis?
Advanced techniques include volume profile analysis, interpreting volume price divergence, analyzing volume in relation to candlestick patterns, and integrating volume analysis with other technical tools.
Can it be combined with other tools?
Yes, with tools like chart patterns, Fibonacci retracements, and candlestick patterns. Integrating these tools provides stronger confirmation signals and enhances the accuracy of trading decisions.
Are there any limitations or challenges with volume price analysis?
Volume data can be less accurate in decentralized markets, and interpreting volume patterns requires experience and proper analysis. False signals or misinterpretations are possible, so risk management and validation from other indicators are important.
Are there any specific trading strategies based on volume price analysis?
Yes, specific trading strategies based on volume price analysis include trend following, reversal trading, scalping, and breakout strategies. These strategies utilize volume as a confirming factor for entry and exit points.
What are some recommended resources for further learning about volume price analysis?
Books like “Mastering the Trade” by John F. Carter and “A Complete Guide to Volume Price Analysis” by Anna Coulling can provide in-depth knowledge. Online resources, forums, and educational platforms dedicated to technical analysis also offer valuable insights for further learning.
WeInvests is a financial portal-based research agency. We do our utmost best to offer reliable and unbiased information about crypto, finance, trading and stocks. However, we do not offer financial advice and users should always carry out their own research.
Read MoreRelated posts:
 Comprehensive Analysis of the AI Market in 2023: Key Players, GPU Shortage, and Future Trends
 Introduction to Stock Trading for Beginners: A Comprehensive Guide
 Mastering the Parabolic SAR: A Comprehensive Guide to Trading with Precision