Stock picking requires thorough analysis to increase your chances of market outperformance and ensure the protection of your capital. You need to make sure that you assess an investment opportunity by examining all relevant factors such as the leverage profile, profitability, growth, valuation, management quality, and market prospects.
This article aims to provide readers with guidance on how to analyze a company before buying its stock. Don’t worry if you’re a total beginner as we are going to prioritize helping you understand the reasoning behind what you will have to do to evaluate stock investment opportunities.
To a large extent, this article will be introductory to the world of equity analysis as it’s simply not possible to equip you with a formula that is going to fit every kind of stock.
With that being said, it will serve you well in getting started with equity analysis as it will provide you with key concepts that you can apply for all stock analysis. It goes without saying that you should consider the intricacies of each industry when you conduct your due diligence, which is well beyond the scope of this article.
Now, without any further ado, let’s get right into business…
Why Fundamental Analysis?
In this article, we will concern ourselves with fundamental analysis which involves evaluating the fundamentals of a business. This is different from reading charts and predicting short-term stock price movements based on historical price data, often used in day trading as well as swing trading. Using fundamental analysis helps you understand the state of the business and if the price you pay for the stock is worth the risk.
More specifically, you will learn how to search for a company’s financial statements, key figures you should look out for, and metrics you can use to evaluate growth, profitability, and value.
Let’s get started with the sources of the data you will require…
Usual Sources
The reports that analysts use are the 10-Q (quarterly report) and the 10-K (annual report). There are multiple sources that you can use to find them:
- Company Websites: Most publicly traded corporations have all the data you need in the Investor Relations section of their websites. On top of the usual quarterly and annual reports, you may also find presentations that help address the most important points regarding the business’ performance.
- Securities and Exchange Commission (SEC): SEC.gov will almost certainly have the reports that you want for a stock if it’s listed on a U.S. exchange as it’s mandatory for all publicly traded companies to file their reports with the Commission.
- Brokerage Platforms: Some brokers also provide the same data found in the reports the company releases, making the process of due diligence faster.
Key Concepts
Now, let us introduce the areas that most analysts focus on when analyzing a stock. We will also include a few tools that you can use to assess each part of the analysis yourself.
Financing and Liquidity
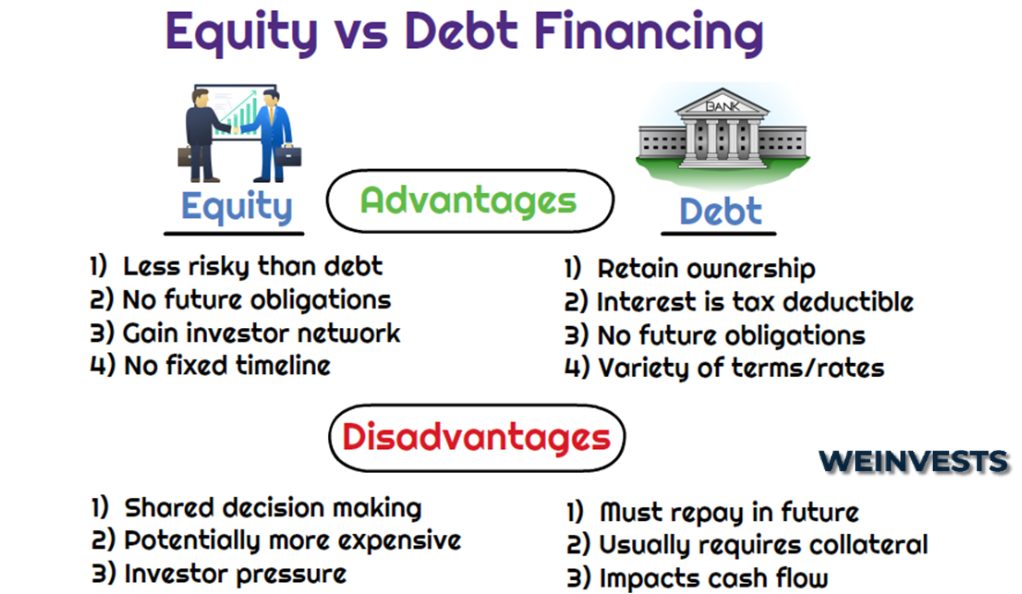
These two things are usually assessed in conjunction because they relate to the creditworthiness of a company.
It’s very important to gauge how financially secure the company you want to invest in is. To that end, looking at how the company is financed and how much liquidity it has will be very useful.
D/E Ratio
The D/E ratio (Debt to Equity) measures the financial structure of a company and it’s a quick way to find out how much leveraged a business is.
The values for this ratio are total debt (sometimes long-term debt, excluding current liabilities) and equity (the “net worth” of the business calculated as total assets minus total liabilities). You can find both the debt and equity figures in the balance sheet section found in the most recent financial report of the company, whichever it is (10-K or 10-Q). When it comes to debt, either search for total liabilities or long-term debt, depending on whether you want to include current liabilities or not.
To illustrate the ratio in practice, if a company has $100 million in long-term debt and $100 million in equity, the D/R ratio would be 1, indicating that the company is financed with as much debt as equity.
Naturally, the lower it is, the more easily the company will weather bad markets.
Interest Coverage
The interest coverage ratio is a liquidity metric that is used to assess how easily the company can pay the interest on its long-term debt. The values used here are the EBIT (Earnings Before Interest and Taxes) and the interest payment; by dividing the first by the latter you can see how many times over the interest the EBIT is. You can find both of them in the income statement included in the most recent 10-Q or 10-K.
For instance, with EBIT at $50 million and interest payment at $5 million, the interest coverage would be 10 times. Naturally, the higher the coverage, the more solvent the business looks.
Current Ratio
The current ratio is a liquidity metric like the interest coverage, but takes into account the current liabilities of a business, instead of its interest payments. It’s calculated by dividing current assets by current liabilities, figures that can be found in the balance sheet of an annual report (you can use a quarterly report for this, but you will have a more accurate idea if you use the most recent annual report or 10-K).
Now, the current assets are assets that can be liquidated within a year and current liabilities are those that have to be paid within a year. As an example, if a company has current liabilities of $400 million and current assets of $500 million, it would have a current ratio of 1.25.
Though this looks sufficient, in adverse circumstances liquidity may thin and a company may become unable to pay off its current liabilities. Such a scenario can force it to take on more debt or issue new shares; both practices which are going to negatively affect the shareholder.
Profitability
Of course, one of the pillars of equity analysis is the profitability of the underlying business. By assessing it, an investor will be able to gauge the attractiveness of the investment opportunity as compared to similar ones.
Let us take a look at some popular metrics that address it…
ROE (Return On Equity)
ROE measures the profitability of a company in relation to the shareholders’ equity and is expressed as a percentage. It is calculated by dividing net income by shareholders’ equity, which can be found in the income statement and balance sheet, respectively. The annual report (10-K) would be the most appropriate source for finding these figures.
If, for example, the 10-K for a company reports $100 million in net income and equity at $1 billion, the ROE would be 10% ($100 million / $1 billion). To know whether the ROE is attractive or not, you will have to take a look at some ROEs of competing companies and see how the company you’re interested in compares.
ROA (Return on Assets)
Similar to ROE, ROA tries to gauge profitability by using net income as the numerator. However, it uses a more conservative denominator, which is the total assets located under the balance sheet. It’s more conservative as it takes into account not just the equity, but also the total debt a company carries.
Gross Profit Margin
The gross profit margin is a profitability metric that both captures the cost-efficiency and profitability of a business. It’s calculated by dividing gross profit by revenue, where gross profit is what remains after deducting the cost of goods sold from revenue. Both figures will be found right at the start of an income statement.
For example, if a company has generated revenue of $50 million and retained $10 million after incurring the cost of goods sold, its gross margin would be 20%. As gross margins differ from one industry to another, make sure to compare companies within the same industry to make use of this metric.
Net Profit Margin
Similar to gross profit margin, the net profit margin can show both how profitable and cost-efficient a business is. It’s calculated by dividing net income by total assets.
Valuation
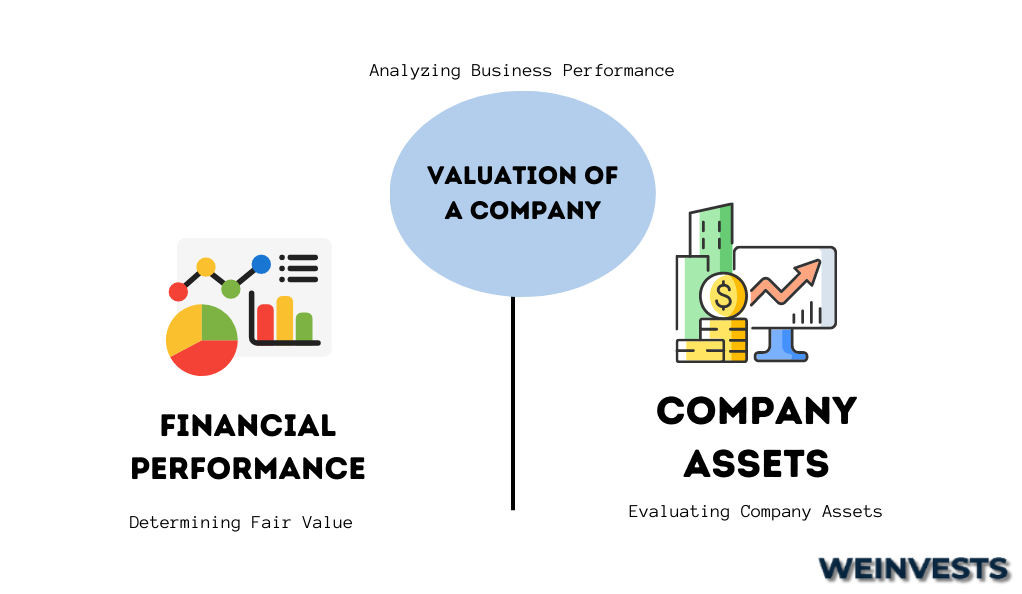
Valuation of a company is the process of determining a fair value (or intrinsic value) for its stock by examining the price of the stock in relation to the performance of the business and its assets.
In this section, we aim to give an introduction to two of the most popular metrics that analysts use to determine fair value.
P/E Ratio (Price/Earnings Multiple)
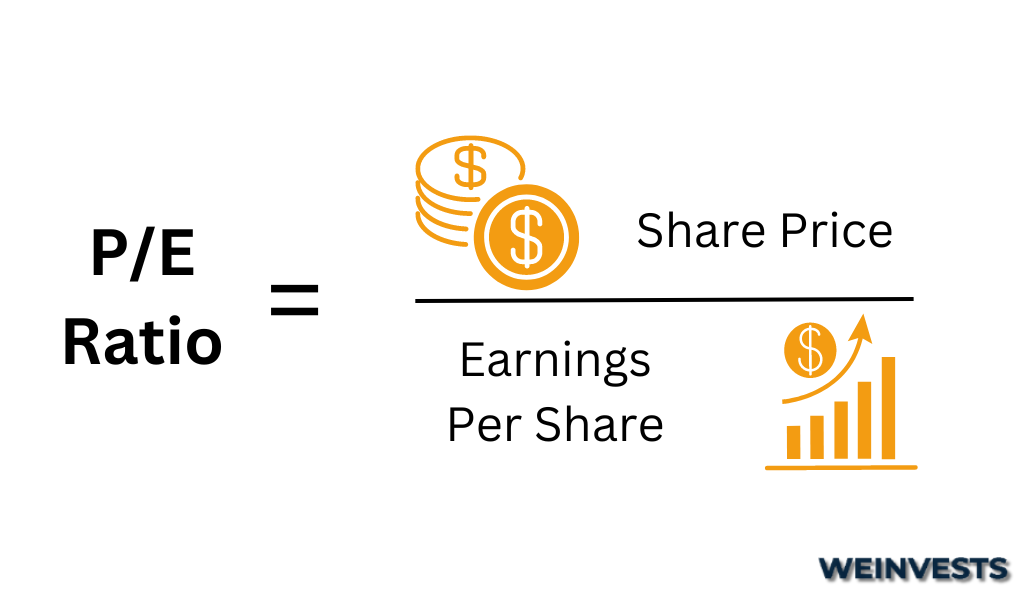
Probably the most famous value metric, the P/E ratio or sometimes called the earnings multiple can help put the price per share in the context of the earnings potential of the company.
By dividing the price per share of a stock by the EPS (Earnings Per Share) the company is expected to earn in the future (forecast net income divided by the number of shares outstanding), you get to see how many times over that earnings estimate the market is currently willing to pay for each share. For instance, if the stock is trading at $100 per share and the forward EPS is at $10, the P/E ratio would be 10, which would imply that investors are willing to pay as much as 10 times the forecast earnings.
The median earnings multiples of industries can vary greatly. Therefore, before you can decide on what is too high or low, make sure to always compare the P/E of a stock to its industry median or to the multiples of a couple of relevant competitors.
A quick online search will give you the P/E ratio for any stock, so there’s no reason to worry about doing the calculation yourself. Just make sure that you understand what type of P/E you look at. Some analysts may use past EPS figures instead of estimates.
P/B Ratio (Price/Book Value Multiple)

The P/B ratio shows you how many times over the book value a stock is trading at. The book value is the same as the shareholders’ equity, which we discussed above, but in per-share form.
Similar to the P/E ratio, the P/B ratio can provide some context regarding the price of a stock. In this case, the context is the assets minus the liabilities of a company that shareholders have a claim on. If, for instance, the stock is trading at $20 per share and the book value is at $10 per share, the P/B ratio would be 2; meaning that the market is willing to pay 2 times the book value.
When searching for a stock’s P/B ratio online, keep in mind that most sources will be using the equity figure reported in the latest quarterly report to calculate book value.
Conclusion
As you can see, analyzing a publicly traded company can amount to a lot of work. Fortunately, after you went through this article, you now know what to search for when looking at a specific company.
Just make sure that you understand the risks implied here before you start applying what you learned here. A good analysis begins with the right questions, which in turn lead to the right inputs… Which also lead to good data.
By this, we mean that the quality of your analysis and the consequent investment performance resulting from it will largely depend on your research abilities when it comes to a specific industry. It would be convenient to have a formula of specific metrics which you can run a stock through, but the variety of markets and business types make this impossible.
This post was meant to familiarize you with some basic concepts that all analysts understand like solvency, liquidity, profitability, cost-efficiency, and value. It can serve as a basis from which you can go forth and create your own process of analyzing stocks in specific sectors and industries.
FAQ
Why is analyzing a company important before buying its stock?
Equity analysis is important because it provides insight into prospects and risks related to an investment opportunity. To bridge the gap between gambling and investing, you should analyze a company as thoroughly as possible before buying its stock.
What are the key factors to consider during equity analysis?
Beside examining market trends or events relating to business moves of a specific company, you should also take care to assess its liquidity, financial structure, performance, and value.
What is the difference between fundamental and technical analysis?
Fundamental analysis is based on the assumption that stock price will reflect the business fundamentals. Technical analysis is based on the assumption that stock price movement patterns will be repeated in the future.
WeInvests is a financial portal-based research agency. We do our utmost best to offer reliable and unbiased information about crypto, finance, trading and stocks. However, we do not offer financial advice and users should always carry out their own research.
Read More