Day trading refers to the practice of buying and selling financial instruments within the same trading day, intending to profit from short-term price fluctuations. It is a fast-paced and highly speculative trading approach that requires traders to make quick decisions based on technical analysis, market trends, and other indicators.
Effective strategies play a crucial role in the success of day trading. Firstly, it helps traders to minimize emotional decision-making, which can lead to impulsive and irrational trading actions. Secondly, it provides a structured approach to trading, allowing traders to stay focused and consistent in their actions. Additionally, a well-designed strategy can help traders to manage risk by setting stop-loss orders and implementing risk-reward ratios.
Table of Contents
- Understanding Pivot Points
- The Role of Pivot Points in Day Trading
- Key Components of Pivot Points
- Pivot Point Trading Strategies
- Tools and Indicators for Pivot Point Analysis
- Advanced Techniques for Utilizing Pivot Points
- Case Studies and Examples
- Risk Management in Pivot Point Trading
- Pitfalls and Challenges in Using Pivot Points
- Summary and Key Takeaways
- FAQ
Understanding Pivot Points
Pivot points are a popular tool used in technical analysis to identify potential support and resistance levels in financial markets. They are calculated based on the previous day’s price actions and can help traders determine key levels where prices may reverse or consolidate.
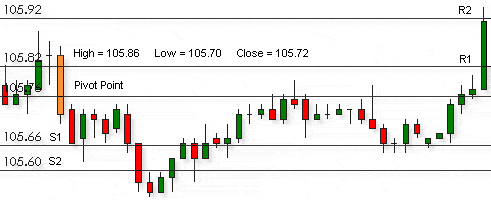
Pivot Point (PP) = (High + Low + Close) / 3
Once the pivot point is determined, several support and resistance levels can be calculated. The primary support and resistance levels are referred to as R1, R2, R3 (resistance) and S1, S2, S3 (support). These levels are calculated as follows:
R1 = (2 x PP) – Low
R2 = PP + (High – Low)
R3 = High + 2 x (PP – Low)
S1 = (2 x PP) – High
S2 = PP – (High – Low)
S3 = Low – 2 x (High – PP)
In addition to standard pivot points, there are other types that traders may use.
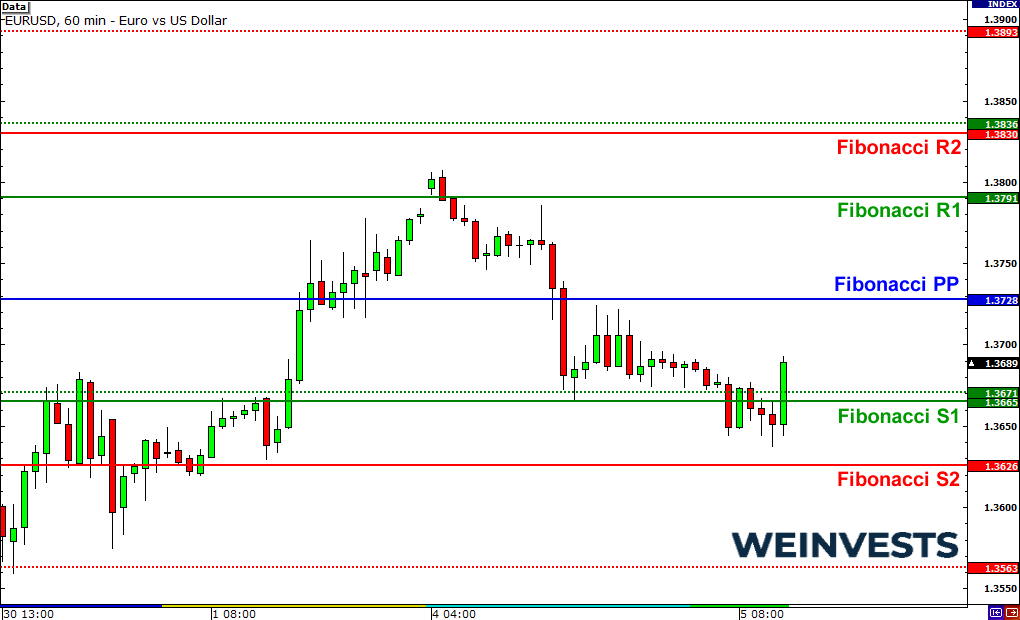
Fibonacci pivot points apply Fibonacci ratios to the calculation of support and resistance levels. These levels are determined by multiplying the difference between the high and low prices by the Fibonacci ratios of 0.382, 0.618, and 1.000, and then adding or subtracting them from the pivot point.
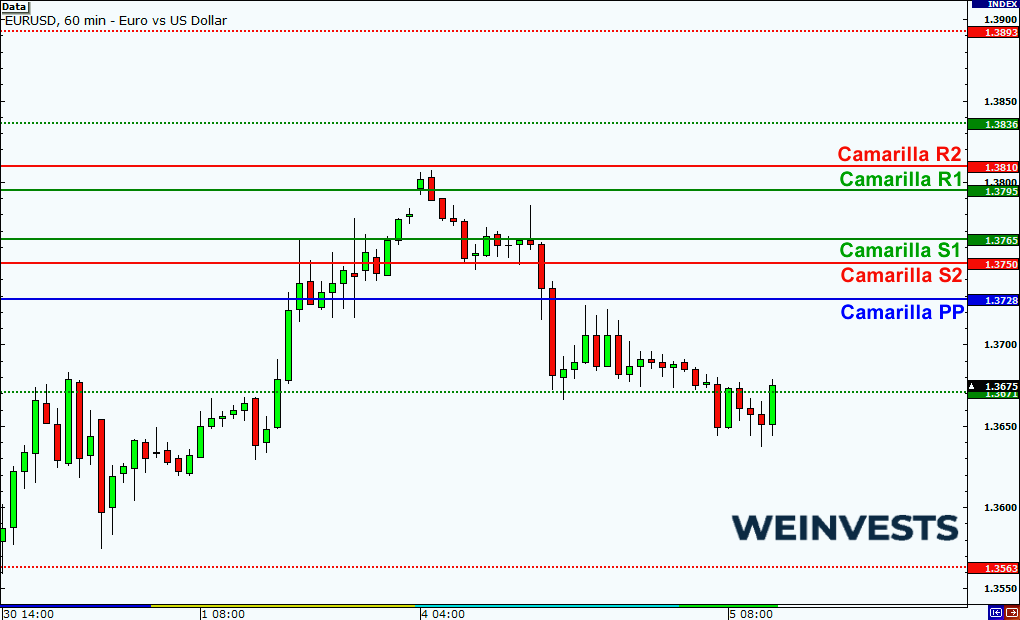
Camarilla pivot points, on the other hand, are based on a different formula that takes into account the previous day’s range. These levels emphasize the importance of the opening price and provide additional support and resistance levels.
The Role of Pivot Points in Day Trading
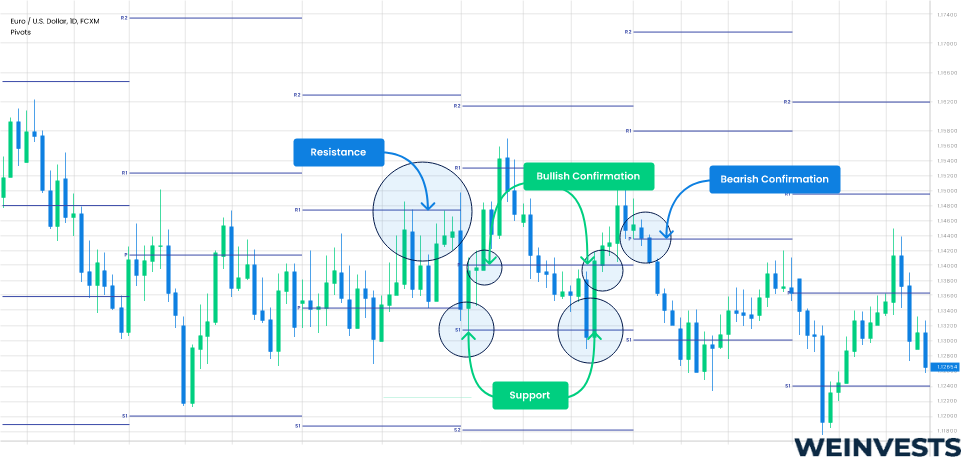
- Identifying Support and Resistance Levels: Support and resistance levels act as barriers where the price may pause, reverse, or consolidate. Traders can use pivot points to determine potential areas of buying (support) or selling (resistance) interest, allowing them to plan their trades accordingly.
- Determining Trend Reversals: Pivot points can also help traders identify potential trend reversals. When the price breaks through a pivot level with conviction, it may signal a change in the market direction.
- Establishing Entry and Exit Points: Pivot points help traders in determining levels of entry and exit points. For example, if the price approaches a resistance level, traders may consider shorting the asset, anticipating a potential reversal. Conversely, if the price bounces off a support level, traders may look for buying opportunities. Pivot points serve as reference points for setting stop-loss orders and profit targets, helping traders manage risk and maximize potential gains.
- Assessing Market Sentiment: Pivot points offer insights into market sentiment. If the price consistently trades above the pivot point and the support levels, it suggests bullish sentiment. Contrariwise, if the price trades below the pivot point and the resistance levels, it indicates a bearish sentiment. Traders can analyze the relationship between the price and pivot points to gauge market sentiment for making better trading decisions.
Unlock the power of pivot points in day trading with eToro, a trusted platform empowering traders with valuable tools. Explore the significance of pivot points, understand their role in identifying potential support and resistance levels, and leverage eToro’s advanced features to make informed trading decisions. Elevate your day trading strategies with eToro’s comprehensive resources today.
Key Components of Pivot Points
The pivot point is the central reference level calculated based on the previous trading period’s high, low, and closing prices. It is a significant level that indicates the overall sentiment of the market.
Support levels are price levels below the pivot point that are expected to provide a level of support to the asset’s price. These levels represent areas where buying interest is likely to emerge, potentially leading to a price bounce or reversal.
Resistance levels are price levels above the pivot point that are expected to act as a barrier to further price appreciation. These levels represent areas where selling pressure is anticipated, potentially leading to a price pullback or reversal.
The range refers to the difference between the high and low prices of the previous trading period. It represents the overall price volatility during that period. Pivot points can help traders identify potential trading ranges by providing support and resistance levels that define the upper and lower boundaries. Range trading strategies often involve buying near support levels and selling near resistance levels within the established range.
Pivot Point Trading Strategies
- Basic Pivot Point Strategy: This strategy uses pivot points, support, and resistance levels to make trading decisions. It helps identify potential reversals or continuations in price trends. The strategy provides clear reference points for setting stop-loss orders and profit targets, enhancing risk management.
- Fibonacci Pivot Point Strategy: This strategy incorporates Fibonacci retracement levels into the calculation of support and resistance levels. It adds additional insights into price reversals or extensions, aligning with natural market dynamics and improving entry and exit points.
- Camarilla Pivot Point Strategy: This strategy focuses on a different formula that considers the previous day’s range and opening price. It provides multiple support and resistance levels, aiding in identifying breakout or bounce opportunities. The strategy is suitable for intraday trading and offers increased flexibility in setting entry and exit points.
Tools and Indicators for Pivot Point Analysis
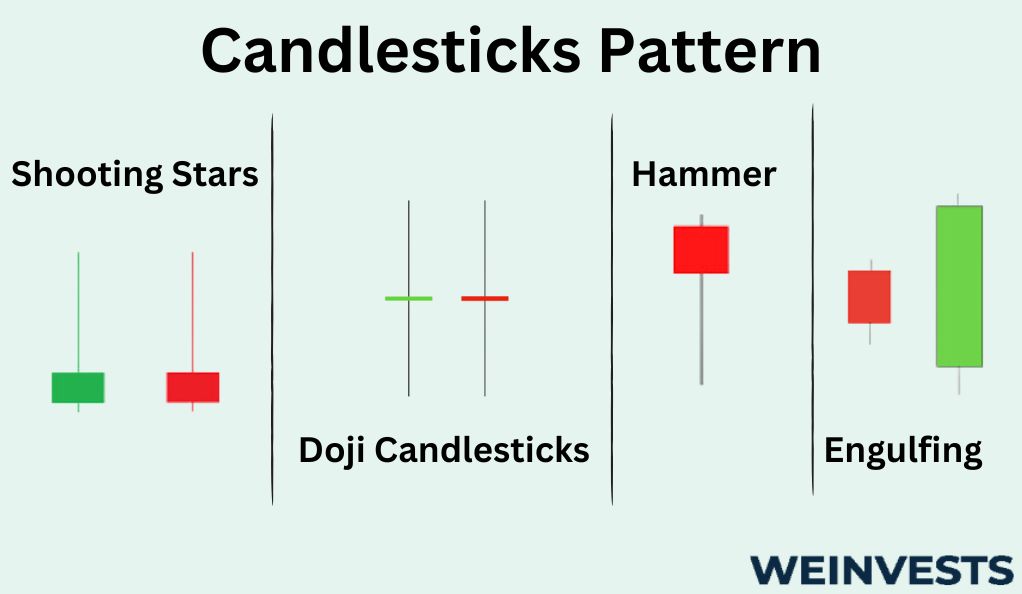
- Candlestick Patterns: Candlestick patterns provide valuable insights into market sentiment and price action. Patterns such as doji, hammer, shooting star, and engulfing patterns can signal potential reversals or continuation of trends around pivot points. Traders often look for these patterns to confirm their pivot point analysis and make trading decisions.
- Moving Averages: Moving averages are widely used indicators that help smooth out price data and identify trends. Traders often use the 50-day, 100-day, and 200-day moving averages to determine the overall trend direction. These moving averages can act as dynamic support or resistance levels around pivot points, providing additional confirmation for potential price reversals.
- Oscillators: Oscillators, such as the Relative Strength Index (RSI) or Stochastic Oscillator, are used to assess the overbought or oversold conditions of an asset. The divergence between the oscillator and price movement around pivot points can also provide valuable insights into market reversals.
Advanced Techniques for Utilizing Pivot Points
By analyzing pivot points across different time frames, traders gain a broader perspective on market trends and potential support/resistance levels. For example, if the daily pivot point aligns with a weekly pivot point, it adds more significance to that level. Traders can use higher time frames to identify major pivot points and lower time frames for precise entry and exit points.
pivot points with other technical indicators can increase the reliability of trading signals. For instance, if a pivot point aligns with a Fibonacci retracement level, a trendline, or a chart pattern, it adds confluence and strengthens the potential support/resistance level. Traders can also incorporate momentum indicators like the MACD or RSI to confirm pivot point signals.
Volume analysis provides insights into market participation and can validate pivot point levels. High volume near a pivot point suggests strong market interest and increases the significance of that level. Traders can observe volume patterns, such as volume spikes or divergences, around pivot points to gauge potential breakouts or reversals.
Case Studies and Examples
Case studies and examples can provide practical insights into how pivot point analysis is applied in real-life trading scenarios. Here’s a step-by-step walkthrough of a trade utilizing pivot points:
Start by calculating pivot points using the high, low, and close prices of the previous trading session. Plot the pivot point, support levels, and resistance levels on your chart.
Look for candlestick patterns around pivot points that indicate potential price reversals or continuations. For example, if a bullish engulfing pattern forms near a pivot support level, it suggests a possible upward move.
Determine the position of the price in relation to key moving averages. If the price is above the moving averages, it confirms a bullish bias, while prices below the moving averages indicate a bearish bias. Ensure the moving averages align with the pivot point analysis.
Apply oscillators such as the RSI or Stochastic Oscillator to assess overbought or oversold conditions. If the price reaches a resistance level near an overbought condition, it strengthens the potential for a reversal.
Check pivot points on different time frames to validate the levels. For instance, if a daily pivot point coincides with a weekly pivot point and aligns with other technical factors, it increases the significance of that level.
Based on the analysis, make a trading decision. For example, if the price bounces off a pivot support level, with confirmation from candlestick patterns and other indicators, consider entering a long position with a target at the next resistance level.
Risk Management in Pivot Point Trading
Risk management is crucial in pivot point trading to protect capital and minimize losses. Here are three important risk management techniques:
- Setting Stop Loss Levels: Traders should determine the maximum acceptable loss for each trade and set stop loss orders accordingly. Stop loss levels are placed below support or above resistance levels to exit the trade if the price moves unfavorably, limiting potential losses.
- Implementing Position Sizing: Traders should carefully allocate the appropriate position size for each trade based on their risk tolerance and account size. Position sizing ensures that no single trade carries excessive risk, helping to preserve capital in case of adverse market movements.
- Managing Risk-Reward Ratios: Traders should aim for favorable risk-reward ratios by setting realistic profit targets relative to their stop loss levels. A positive risk-reward ratio ensures that potential profits outweigh potential losses, increasing the overall profitability of the trading strategy.
Pitfalls and Challenges in Using Pivot Points
Using pivot points in trading activity is not always as simple as it may sound. False breakouts may occur when the price briefly surpasses a pivot level but fails to sustain the move. Overreliance on pivot points without considering other indicators can therefore be risky. Market volatility can also impact the accuracy of pivot point levels. Traders should be cautious, apply risk cushions, and incorporate additional analytical tools for mitigating these challenges.
Summary and Key Takeaways
Obviously, pivot points play an important role in shaping day trading strategies by identifying support and resistance levels, determining trend reversals, establishing entry and exit points, as well as assessing market sentiment. Traders can utilize basic pivot point strategies, Fibonacci or Camarilla pivot point approaches to enhance their trading decisions and results. They can also incorporate candlestick patterns, moving averages, and oscillators as additional tools to their pivot point analysis. Advanced techniques such as multiple timeframe analysis, confluence with other indicators, and volume analysis may further improve the application efficiency of pivot points.
Meanwhile, traders should be aware of the potential issues and risks associated with pivot points, including false breakouts, overreliance on pivot points, and the impact of market volatility. By employing risk management techniques and avoiding these pitfalls efficiently, traders would maximize the benefits of pivot point analysis in their day trading activities.
FAQ
How often should I recalculate pivot points?
Pivot points should be recalculated daily at the beginning of each trading session.
How do I identify the most reliable pivot points?
The most reliable pivot points are those that align with other technical indicators, exhibit confluence, coincide with higher trading volumes, and have a history of price reactions.
What are some common mistakes to avoid when using pivot points?
Possible common mistakes include overreliance, neglecting market context, ignoring stop-loss levels, not adapting to changing market conditions, chasing false breakouts, as well as lack of back-testing and practice while using pivot points.
WeInvests is a financial portal-based research agency. We do our utmost best to offer reliable and unbiased information about crypto, finance, trading and stocks. However, we do not offer financial advice and users should always carry out their own research.
Read More