Brian Flaherty
16 posts
Brian's interest in finance started from an early age, when he used the money saved from working summer jobs to purchase his first mutual fund at 15.
He went on to pursue the field in school, eventually graduating from the University of Virginia with a Bachelor's degree in Economics. After graduation, Brian put his knowledge to work advising institutions and high-net-worth investors as a strategist at a wealth management firm. Recently, Brian transitioned to pursue a career as a financial writer, where he leverages his writing skills and financial knowledge to help investors everywhere make the best decisions.
Brian lives in Hoboken, New Jersey, which he appreciates due to its proximity to Manhattan, the financial center of the world.
How to build an emergency fund: Tips and strategies.
An emergency fund is an easily accessible stash of money that you can use to weather high-cost, unplanned life events. It’s an essential, but often overlooked, part of any financial plan.
Financial planning for retirement: A step-by-step guide
To reach your goal of enjoying your golden years without needing to worry about working, you’ll need to organize a thorough financial plan.
The Role of AI and Machine Learning in Modern Finance
The future of AI in the financial industry is exciting, if uncertain. One thing is for sure, though – the industry as a whole will continue to embrace cutting-edge technology in order to generate profits, improve returns, and stay one step ahead of the competition.
How to Use Bollinger Bands for Effective Market Analysis
Bollinger Bands are a widely-used technical indicator that can provide valuable insights into market volatility and trend direction. This guide offers a comprehensive overview of how to effectively use Bollinger Bands in your trading strategy, from understanding the underlying calculations to applying them in various market scenarios. Whether you're looking to identify overbought or oversold conditions, recognize potential breakouts, or gain a deeper understanding of market dynamics, Bollinger Bands can be a powerful tool in your trading arsenal. Learn how to leverage them to their full potential with this practical and insightful guide.
Trading with Trend Lines – Techniques, Strategies, and Insights
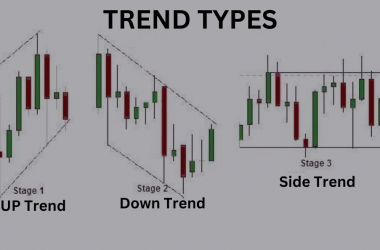
Trend lines are fundamental tools in technical analysis, helping traders to understand market direction and identify potential support and resistance levels. This guide provides a comprehensive overview of how to effectively use trend lines in trading, covering everything from drawing accurate lines to interpreting breakouts and breakdowns. Whether you're a novice trader looking to understand the basics or an experienced professional seeking to refine your approach, this guide offers valuable insights and practical techniques to enhance your trading strategy with trend lines.
Average True Range (ATR) Explained: Strategies for Analyzing Volatility
The Average True Range (ATR) is a vital tool for analyzing market volatility, providing insights into the range of price movements over a specific period. This guide offers a detailed overview of how to use the ATR effectively in your trading strategy, from understanding its calculation to applying it in various market conditions. Whether you're looking to set more accurate stop-loss levels or gain a deeper understanding of market behavior, the ATR can be a valuable asset in your trading toolkit. Learn how to leverage this powerful indicator to navigate the markets with greater precision and confidence.
How to Use the Stochastic Oscillator for Profitable Trading
The Stochastic Oscillator is a popular momentum indicator that can provide valuable insights into potential price reversals. By comparing a particular closing price of a security to its price range over a specific time period, it helps traders identify overbought and oversold conditions. This guide offers a comprehensive overview of how to effectively use the Stochastic Oscillator in your trading strategy, from understanding its calculations to implementing it in various market scenarios. Whether you're new to technical analysis or looking to refine your approach, this guide equips you with the knowledge to trade more profitably using the Stochastic Oscillator.
Price Action Trading Explained: Strategies, Techniques, and Insights
Price Action Trading is a powerful approach that focuses on the analysis of pure price movements, free from the influence of technical indicators. This comprehensive guide delves into the core principles of Price Action Trading, offering insights into recognizing patterns, understanding market psychology, and implementing effective strategies. Whether you're a novice trader or an experienced professional, this guide provides the tools and knowledge needed to harness the power of price action and achieve trading success.
Mastering the Parabolic SAR: A Comprehensive Guide to Trading with Precision
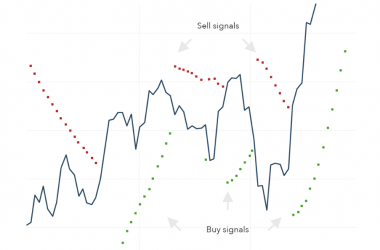
The Parabolic SAR (Stop and Reverse) is a valuable technical indicator used by traders to predict potential reversals in market trends. This guide offers a comprehensive understanding of the Parabolic SAR, including its calculation, interpretation, and practical application in trading. From setting optimal stop-loss levels to recognizing bullish and bearish signals, this guide provides the insights and strategies you need to use the Parabolic SAR effectively in your trading endeavors.
Trading with the Elliott Wave Theory: A Beginner’s Guide
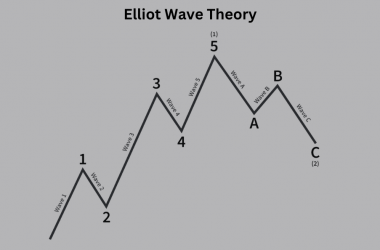
Elliott Wave Theory is a renowned method of technical analysis that interprets market trends by identifying wave patterns. This beginner's guide demystifies the complex world of Elliott Wave Theory, providing a clear and concise introduction to its principles, wave structures, and practical applications in trading. Whether you're new to the financial markets or looking to enhance your analytical toolkit, this guide offers valuable insights into one of the most intriguing and widely-used approaches in modern trading.


