Introduction

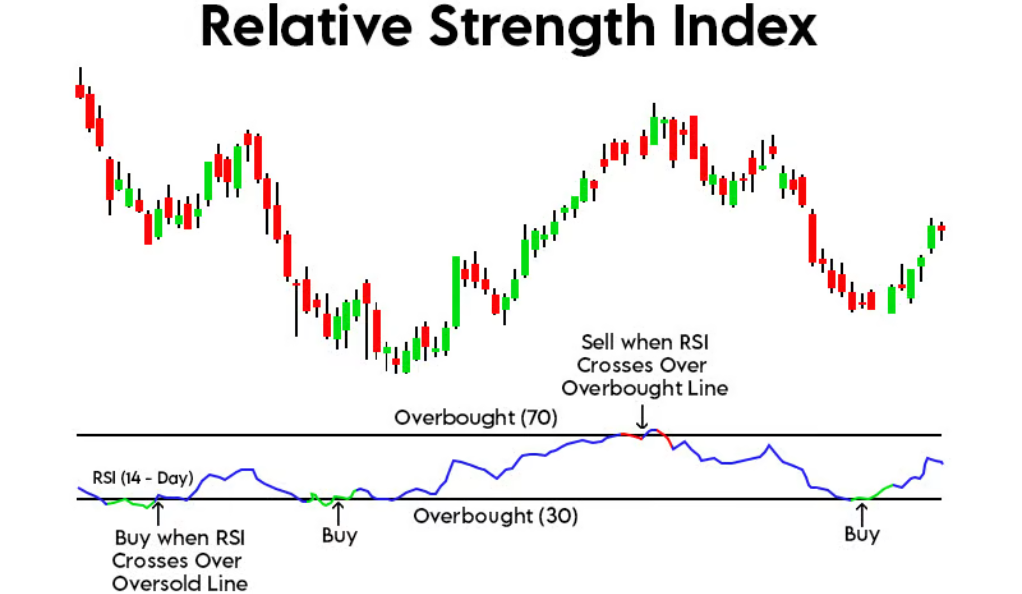
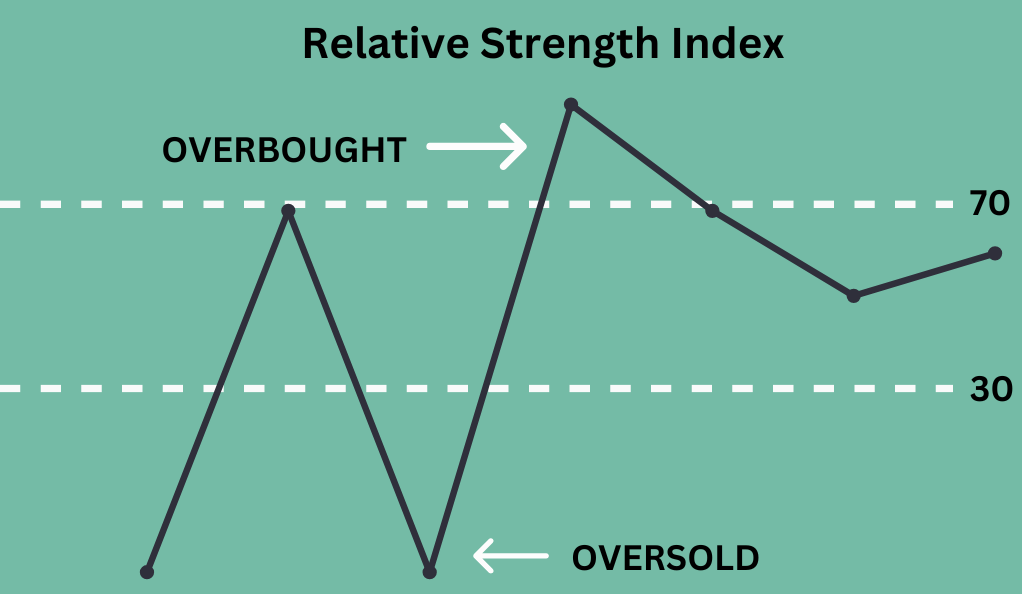
The Relative Strength Index (RSI) is a widely used technical indicator in trading that measures the magnitude and speed of price changes in a stock or other financial instrument. RSI is based on the concept that overbought and oversold conditions can indicate potential reversals in price trends. It ranges from 0 to 100, with values above 70 suggesting overbought conditions and values below 30 indicating oversold conditions. Traders use RSI to identify potential entry and exit points, confirm trends, and assess the strength of price movements. By incorporating RSI into their analysis, traders can gain insights into market dynamics, make more informed trading decisions, and potentially capitalize on market reversals and opportunities.
Understanding RSI Basics
The RSI is calculated using a formula that compares the average gains and losses over a specified period. The formula breakdown involves several steps:
- Calculate the average gain by summing up all positive price changes over the selected period and dividing it by the number of periods.
- Calculate the average loss by summing up all negative price changes (or zero if there are no losses) over the selected period and dividing it by the number of periods.
- Calculate the relative strength (RS) by dividing the average gain by the average loss.
- Calculate the RSI using the following formula: RSI = 100 – (100 / (1 + RS)).
A reading above 70 suggests a potential reversal or pullback in price. Conversely, a reading below 30 indicates a potential bounce or upward movement. Traders often look for divergences between RSI and price, where RSI shows a different trend than the price, signaling a potential reversal.
The choice of RSI timeframes depends on the trading style and goals. Shorter timeframes, such as 14 days, are commonly used for shorter-term trading, while longer timeframes, such as 50 or 200 days, are used for longer-term analysis. Different timeframes provide different levels of sensitivity to price changes.
Interpreting RSI Signals
When using the Relative Strength Index (RSI), traders often pay attention to overbought and oversold levels to identify potential price reversals. As we saw above, RSI values above 70 are considered overbought, indicating that the price may be due for a pullback or correction. Conversely, RSI values below 30 are considered oversold, suggesting that the price may be poised for a bounce or upward movement. These levels serve as important reference points for traders to assess the potential strength or weakness of an asset’s price.
Another valuable aspect of RSI analysis is observing divergences between RSI and price movements. A bullish divergence occurs when the price forms a lower low while the RSI forms a higher low, suggesting a potential bullish reversal. Bearish divergence, on the other hand, occurs when the price forms a higher high while the RSI forms a lower high, indicating a possible bearish reversal. These divergences can provide early signals of trend changes or upcoming reversals in the price.
RSI failure swings are also significant in identifying potential trend reversals. A bullish failure swing occurs when the RSI falls below 30, rises above a recent peak, and then falls again, signaling a potential trend reversal to the upside. Conversely, a bearish failure swing happens when the RSI rises above 70, falls below a recent trough, and then rises again, indicating a possible trend reversal to the downside.
To enhance the effectiveness of RSI analysis, many traders combine it with other technical indicators. For example, traders may look for confirmation signals from trendlines, moving averages, or volume patterns. The convergence of multiple indicators can strengthen the validity of trading signals and increase confidence in the analysis.
Using RSI for Trend Identification
The Relative Strength Index (RSI) is not only useful for identifying overbought and oversold conditions but also as a trend-following indicator. Traders can utilize RSI to identify and confirm bullish and bearish trends in the market.
When the RSI consistently stays above 50, it suggests a bullish trend, indicating that buying pressure is dominant and the price is likely to continue moving upward. Conversely, when the RSI consistently stays below 50, it suggests a bearish trend, indicating that selling pressure is dominant and the price is likely to continue moving downward. This helps traders align their positions with the prevailing trend and avoid counter-trend trades.
RSI trendline analysis is another technique to identify trend strength. By drawing trendlines on the RSI chart, connecting the highs and lows of the indicator, traders can observe if the trendline is sloping upwards or downwards. An upward-sloping trendline confirms a bullish trend, while a downward-sloping trendline confirms a bearish trend. The steepness of the trendline can provide insights into the strength of the trend.
In addition to trendline analysis, traders can gauge the strength of a trend by observing RSI levels during price retracements. In a strong uptrend, for example, the RSI tends to stay above 40 or 50 during price pullbacks, indicating robust buying pressure. Similarly, in a strong downtrend, the RSI tends to stay below 60 or 50 during price rallies, suggesting significant selling pressure. This confirmation of trend strength can help traders make informed decisions about the continuation or potential reversal of a trend.
RSI Trading Strategies

The Relative Strength Index (RSI) is a versatile indicator that can be applied to various trading strategies. Let’s explore four common RSI-based strategies: the overbought/oversold strategy, divergence strategy, pullback strategy, and breakout strategy.
- Overbought/Oversold Strategy: The overbought/oversold strategy involves using RSI levels to identify potential reversals. When the RSI reaches or exceeds 70, it suggests the asset is overbought and may be due for a pullback. Traders can consider selling or taking profits. Conversely, when the RSI falls to or below 30, it indicates oversold conditions, potentially signaling a buying opportunity. Traders can look for potential reversals and consider buying the asset.
- Divergence Strategy: The divergence strategy involves looking for divergences between price and RSI. As we saw above, a bullish divergence occurs when the price forms a lower low while the RSI forms a higher low. This suggests potential upward momentum and a potential buying opportunity. A bearish divergence occurs when the price forms a higher high while the RSI forms a lower high, indicating potential downward momentum and a potential selling opportunity. Traders can use these divergences to anticipate trend reversals and make trading decisions accordingly.
- Pullback Strategy: The pullback strategy combines RSI with price pullbacks. In an uptrend, when the RSI pulls back from overbought levels but remains above 50, traders can look for opportunities to buy the asset on the pullback. Similarly, in a downtrend, when the RSI pulls back from oversold levels but remains below 50, traders can look for opportunities to sell the asset on the pullback. This strategy allows traders to enter trades in the direction of the prevailing trend.
- Breakout Strategy: The breakout strategy involves using RSI to identify potential breakouts from consolidation patterns. Traders can look for a period of range-bound price action with RSI moving between 30 and 70. When the RSI breaks out above 70, it signals potential bullish strength and a possible entry for long positions. Conversely, when the RSI breaks out below 30, it indicates potential bearish strength and a possible entry for short positions. Traders can use breakout signals to enter trades in the direction of the breakout.
Advanced RSI Techniques
The Relative Strength Index (RSI) can be enhanced by incorporating various smoothing techniques, multiple time frame analysis, volume analysis, and the use of moving averages. These additional tools provide traders with valuable insights and help refine RSI-based trading strategies.
- Smoothing Techniques: RSI smoothing techniques help reduce noise and provide a smoother RSI line, making it easier to identify trends and potential reversals. Common smoothing methods include applying a moving average to the RSI line or using Wilder’s smoothing formula. These techniques can provide a clearer representation of RSI movements, making it easier for traders to make informed decisions.
- Multiple Time Frame RSI Analysis: Analyzing RSI across different time frames can provide a comprehensive view of price momentum. Traders can use higher time frame RSI to determine the overall trend direction and lower time frame RSI to identify potential entry or exit points. This multi-timeframe analysis helps traders align their trades with the prevailing trend while identifying short-term opportunities.
- RSI with Volume Analysis: Combining RSI with volume analysis can provide insights into the strength and validity of price movements. When RSI forms a bullish or bearish signal while accompanied by a surge in volume, it adds confirmation to the potential trend reversal. Higher volume during a breakout or divergence can indicate strong participation and support the reliability of the RSI signal.
- RSI with Moving Averages: Integrating moving averages with RSI can enhance trend identification and generate trading signals. Traders often use a shorter-term moving average (such as a 9-day or 14-day) and a longer-term moving average (such as a 50-day or 200-day) in combination with RSI. The moving averages help filter out noise and provide additional confirmation of trend direction when they align with RSI signals.
RSI and Risk Management
Setting stop-loss levels based on RSI, incorporating RSI into position sizing decisions, and using RSI as a confirmation tool for risk management are important techniques that traders can utilize to effectively manage their risk exposure.
- Setting Stop-Loss Levels based on RSI
Traders can use RSI to determine appropriate stop-loss levels. For example, in a long trade, if the RSI drops below a specific threshold (e.g., 30), it could indicate weakening momentum and potential further downside. Setting a stop-loss just below this level can help protect against excessive losses if the trade goes against expectations. Similarly, in a short trade, if the RSI rises above a certain threshold (e.g., 70), it may signal strengthening momentum and potential upward movement. Placing a stop-loss just above this level can mitigate risk in case the trade moves unfavorably. - RSI and Position Sizing
Traders can incorporate RSI into their position sizing decisions to align risk exposure with market conditions. When RSI indicates a strong trend, traders may consider increasing their position size to capitalize on the anticipated movement. Conversely, if RSI indicates a choppy or uncertain market, reducing position size can help limit potential losses. - RSI as a Confirmation Tool for Risk Management
RSI can serve as a confirmation tool when making risk management decisions. For instance, if a trader is considering taking a trade but sees that RSI is overbought or oversold, it may indicate a higher probability of a trend reversal or pullback. This confirmation can help traders make more informed decisions about their risk exposure, such as adjusting stop-loss levels, scaling out of positions, or avoiding the trade altogether.
Backtesting and Optimizing RSI Strategies
Backtesting RSI strategies is a crucial step in trading to assess the viability and performance of a particular approach. It involves applying historical data to test the effectiveness of RSI signals and parameters. Here are important considerations when backtesting RSI strategies:
Firstly, selecting appropriate historical data is essential. Ensure the dataset covers various market conditions, including different market cycles, trending and ranging periods, and volatile and stable environments. This comprehensive historical data provides a more accurate representation of strategy performance.
Next, evaluate the performance of the RSI strategy by analyzing key metrics such as profitability, drawdowns, win rate, and risk-reward ratio. This assessment helps identify the strengths and weaknesses of the strategy and provides insights into its potential profitability and risk management capabilities.
Furthermore, optimizing RSI parameters can lead to better results. By adjusting the look-back period or overbought/oversold levels, traders can find optimal values that align with specific market conditions. However, caution should be exercised to avoid over-optimization, which can result in curve-fitting and unreliable results.
Common Mistakes to Avoid
When using the Relative Strength Index (RSI) as a trading tool, it’s important to be aware of common mistakes to avoid. Misinterpreting RSI signals is a common error, as traders may mistakenly assume overbought or oversold conditions automatically guarantee a price reversal. RSI should be used in conjunction with other technical indicators and confirmation signals for better decision-making.
Another mistake is overreliance on RSI without considering other factors. RSI is just one tool among many, and relying solely on it can lead to missed opportunities or false signals. It’s essential to consider market conditions, price patterns, and fundamental factors that can influence price movements.
Neglecting market conditions and fundamentals is another pitfall. RSI should be used in the context of the overall market environment, including economic data, news events, and industry trends. Ignoring these factors can lead to poor trading decisions.
Lastly, failing to adapt RSI to different timeframes is a mistake. RSI signals may vary depending on the timeframe used, so it’s important to adjust the parameters accordingly. What works on a daily chart may not be as effective on an hourly or weekly chart. Adapting RSI to different timeframes ensures its relevance and accuracy.
Summary and Key Takeaways
The Relative Strength Index (RSI) is a popular technical indicator used in trading to measure the magnitude and speed of price changes. It ranges from 0 to 100, with values above 70 indicating overbought conditions and values below 30 indicating oversold conditions. Traders use RSI to identify potential entry and exit points, confirm trends, and assess the strength of price movements. RSI can also be used for trend identification, risk management, and in combination with other technical indicators. However, traders should avoid common mistakes such as misinterpreting RSI signals, overreliance on RSI, neglecting market conditions and fundamentals, and failing to adapt RSI to different timeframes. Backtesting and optimizing RSI strategies can help traders assess their viability and performance.
Frequently Asked Questions (FAQs)
What is the optimal period for RSI calculation?
The optimal period for RSI calculation depends on the trader’s strategy and the financial instrument being analyzed. A common period is 14, but some traders use shorter or longer periods.
Can RSI be used for all types of financial instruments?
RSI can be used for all types of financial instruments such as stocks, bonds, commodities, and currencies.
How can RSI be adjusted for volatile markets?
To adjust RSI for volatile markets, traders can increase the period of RSI or use a higher threshold value.
What other indicators complement RSI analysis?
Other indicators that complement RSI analysis include Moving Average Convergence Divergence (MACD), Relative Vigor Index (RVI), and Bollinger Bands.
Is RSI applicable for long-term investing?
Yes, RSI is applicable for long-term investing, but in this case it should be used in combination with fundamental analysis.
How do I avoid false signals when using RSI?
To avoid false signals when using RSI, traders can use RSI in conjunction with other indicators, and wait for confirmation.
Can RSI predict market reversals accurately?
While RSI can provide indications of market reversals, it is not always accurate. This is why it is important to be used in conjunction with other indicators.
What are the common drawbacks of RSI?
Common drawbacks of RSI include false signals, sensitivity to market volatility, and inability to predict market reversals accurately.
How should I combine RSI with other indicators?
By combining RSI with other indicators such as MACD traders can look for confirmation of signals. For example, if RSI indicates an oversold condition, traders can look for confirmation from other indicators, such as Moving Averages, before making a trade. Combining RSI with other indicators can help to reduce false signals and provide more accurate signals.
Is RSI suitable for day trading?
Yes, RSI is suitable for day trading.
WeInvests is a financial portal-based research agency. We do our utmost best to offer reliable and unbiased information about crypto, finance, trading and stocks. However, we do not offer financial advice and users should always carry out their own research.
Read More


