This content represents the writer’s opinions and research and is not intended to be taken as financial advice. The information presented is general in nature and may not meet the specific needs of any individual or entity. It is not intended to be relied upon as a professional or financial decision-making tool.
Solana has been wickedly bullish in 2021, even by crypto standards but 2022 saw some of the trading activity cooled down.
It’s like a crypto wizard personally got its back.
Imagine knocking Cardano out of its position barely two months after it went down for hours in September; such an outage by itself is enough to kill most cryptocurrencies for good.
But has SOL run out of its bullish juice?
Solana is one of the largest cryptocurrencies in the market, with a total market cap of over $4 billion. It has experienced a significant decline in its value since its high of almost $250 in 2021. Despite its potential, it does not have the same network activity as Ethereum. Developers will need to develop applications on Solana using a more niche coding language, and this friction will prevent them from creating good decentralized applications.What exactly does this mean for SOL’s future.
Remember, a good chunk of Crypto experts predicted a wiggle room for SOL into a four-figure upside if BTC and ETH could hit six and five figures respectively in 2021’s Q4.
That didn’t happen.
Before you write SOL off, think back.
Solana had a massive investors inflow and appreciated from $1.84 to an over $250 ATH within a few months in 2021 and is currently trading at $13.95.
But how far will SOL fall before it hits a support strong enough to bounce it back?
Coindesk reports a recent lag intensified SOL bearishness in Solana’s block speed.
What does this mean for your SOL investment?
What is SOL’s future in the coming years?
Read on to learn about our expert Solana’s Price Analysis and Solana Price Forecasts.
Table of Contents
SOL Price Statistics
Solana Price Forecast Technical Analysis
Considering Solana’s nature and use-cases, investors hope Solana will hit the moon in the coming years, as the project is still in its early phase.
Regardless of this fact, here’s our analysis of SOL’s fate.
Q1/Q2 2022
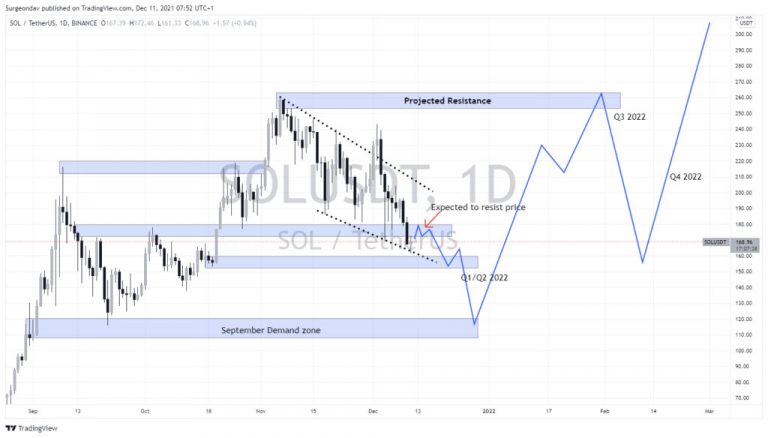
As you can see in the chart above, SOL price is trading below the recently-broken S/R zone and now has found another support on the trend line, pushing the price back to the S/R zone.
The S/R zone resisted the breakout considering the massive volume of the bears at the moment; this is beside the trendline support’s demand strength lack to push the price to the upside significantly.
According to the Solana price analysis, the market is currently in a bear trend and the prices are expected to continue falling. Support levels that investors should watch out for are around $12.04, and if these support levels are broken, then further losses can be expected. On the other hand, the technical indicators are also indicating that the price may fall further.
Q1/Q2 2023
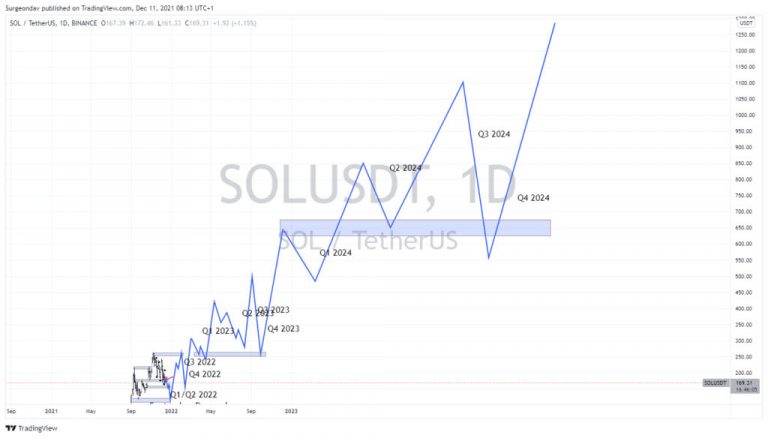
Our confidence that Q1 2023 will break the 2022 ATH is pretty high, but at the same time sells pullbacks might come into play.
The ATHs resistance zone is projected to also act as support in the coming months and bounce the price to retest this current ATH before 2023 can make its own first ATH.
Q3/Q4 2023
It is projected to start bearish, then return to retest the “ATHs resistance turned support zone” for the second or third time before it might finally make another record Solana ATH to trade above $620.
Q1/Q2 2024
We’ve got no actual data to leverage for predicting the 2024 movement, but we can still utilize Solana’s historical play in recent years.
We expect a more significant move for this year than the former. Because there’d be more investors at this time, ultimately boosting Solana’s trade volume.
Q1/ Q2 is expected to pan out entirely bullish and probably trade as high as $1100 and above.
Q3/Q4 2024
As is usual with SOL, we expect a big dump in 2024 Q3 to prepare for another bull run to set a new ATH.
The Q3 sell is necessary to fill the imbalance in structure and gather demand strength for the Q4 move.
The retracement is also to validate the already broken resistance zones as a valid support for the price.
We predict Q3 to have a 300% decrease in price before Q4 takes over to ride the price as high as $1300, making an 800% move to the upside.
In conclusion, SOL is relatively at its early phase, and according to top Solana Governing members and Solana’s Roadmap, Solana is still in its beta stage. Seeing such performance from a coin in its test phase says a lot about its future.
SOL Price History
| Date | Open | High | Low | Close* | Adj Close** | Volume |
| Dec 11, 2021 | 167.90 | 172.32 | 162.13 | 169.57 | 169.57 | 2,398,816,768 |
| Dec 01, 2021 | 208.39 | 243.11 | 167.95 | 167.95 | 167.95 | 33,634,630,903 |
| Nov 01, 2021 | 202.63 | 260.06 | 182.37 | 208.67 | 208.67 | 88,928,013,588 |
| Oct 01, 2021 | 141.38 | 218.73 | 137.81 | 202.42 | 202.42 | 95,049,599,341 |
| Sep 01, 2021 | 107.44 | 214.96 | 106.27 | 141.07 | 141.07 | 158,253,964,986 |
| Aug 01, 2021 | 36.68 | 130.01 | 32.40 | 108.48 | 108.48 | 55,557,743,675 |
| Jul 01, 2021 | 35.51 | 38.01 | 22.18 | 36.83 | 36.83 | 11,907,534,842 |
| Jun 01, 2021 | 32.77 | 44.10 | 20.38 | 35.56 | 35.56 | 21,093,645,183 |
| May 01, 2021 | 42.89 | 58.30 | 19.14 | 32.82 | 32.82 | 31,090,298,933 |
| Apr 01, 2021 | 19.42 | 48.43 | 18.57 | 42.96 | 42.96 | 19,636,381,495 |
| Mar 01, 2021 | 13.11 | 20.87 | 11.90 | 19.47 | 19.47 | 4,765,318,582 |
| Feb 01, 2021 | 4.26 | 18.15 | 4.12 | 13.09 | 13.09 | 4,848,510,932 |
| Jan 01, 2021 | 1.51 | 4.79 | 1.50 | 4.26 | 4.26 | 1,998,542,966 |
| Dec 01, 2020 | 1.97 | 2.22 | 1.09 | 1.51 | 1.51 | 355,105,302 |
| Nov 01, 2020 | 1.54 | 2.50 | 1.28 | 1.97 | 1.97 | 488,252,349 |
| Oct 01, 2020 | 2.90 | 2.99 | 1.34 | 1.54 | 1.54 | 255,229,935 |
| Sep 01, 2020 | 4.78 | 4.94 | 2.67 | 2.90 | 2.90 | 186,793,572 |
SOL Price Analysis
2020
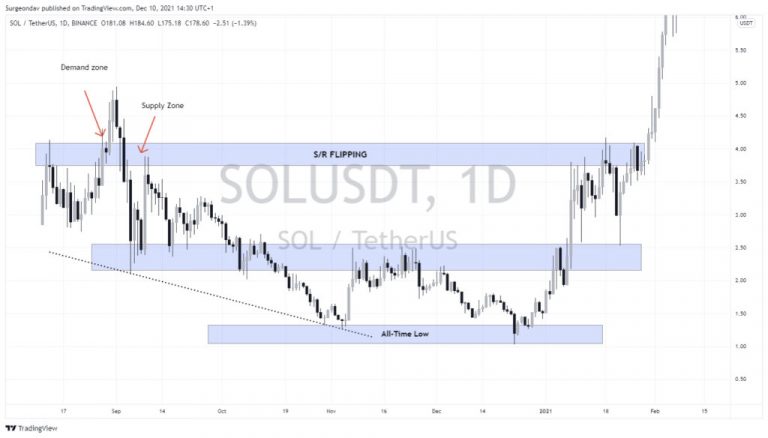
Solana 2020 Q4 bearish momentum was enough to shatter investors’ faith in Solana completely, but Solana proved its early beginning does not determine its future.
Beyond imagination, Solana has made remarkable buy moves in the past months.
A trend started from August 13th, 2020, when Solana made an intraday high, creating a resistance zone around the $4 price zone.
After a while, it broke, leaving behind a demand zone to establish a higher high, trading around $4.90 before dipping the price once more to break the last low as a confirmation of a bearish structure in play.
As the Market progressed, the price found support at the $2.2 and $2.5 zone.
Later, it caused a sell retracement to the initially created $4 resistance zone, which proved strong by rejecting the buy orders to trade back to the support zone where the price ranged for a while.
On failing to retest the resistance zone, SOL sold and consolidated at the support zone before breaking out of the zone with a low momentum and sold at around $2.3, where it established another significant support.
The price immediately retested the support with what seems to be a strong momentum considering the bullish engulfing pattern that sponsored the short buy, which got resisted by the recently-broken support.
The buying impulse could not break the resistance after consolidating at the zone in a distribution manner; instead, it sent the back price to the All-time low support.
Q1 2021
Solana’s all-time low support was retested on December 23rd, 2020.
The support bounced the price 110% upward back into the psychological resistance during 2021 first two days.
After this, the price experienced a minor rejection to the intraday demand zone to gather demand strength which ultimately pushed the price to the $3.0-$4.0 price zone.
Remember, the Market created this resistance zone on August 13th, 2020, and retested it a month later.
This was the same zone that got tested again on the first two weeks of the New Year.
After a couple of further trials, the resistance finally gave way and launched the price to the upside; the price had to arm itself with daily timeframe support to break through.
A daily base candle formed at the newly-found support, which indicated that the market makers kept money at that price zone and would come back to pick up their money, which they did.
The price then retraced to the demand zone and gathered enough volume to sponsor a strong buy momentum after it must have mitigated and taken out traders who were hoping for a longer buy.
The demand aggressively pushed the price to break the longstanding resistance zone driving the price as many buy orders came in hot.
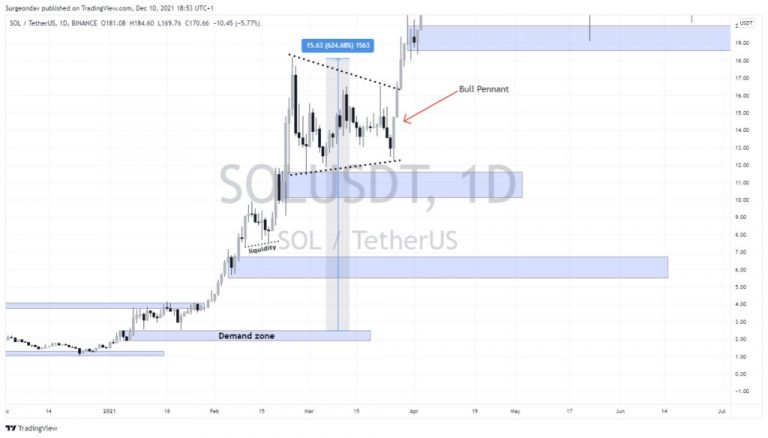
This bullish breakout took SOL price to around $5.6 and $6.5, where it consolidated with a short nap leaving behind an order block candle.
The order block candle suggested the Market could return to retest that zone, but that didn’t happen, even though the presence of liquidity did validate the zone.
The price continued to rally by making highs and lows, depicting a clear picture of a bullish market. But towards the February end, the price made a bull pennant pattern technically referred to as a continuation pattern indicating that the bulls relaxed and gave the bears some breathing space at that point.
Just as the bears thought the Market was theirs, the bulls jumped awake and took the market 600%+ into the bull pennant zone to close off Q1 and kick start Q2.
Q2 2021
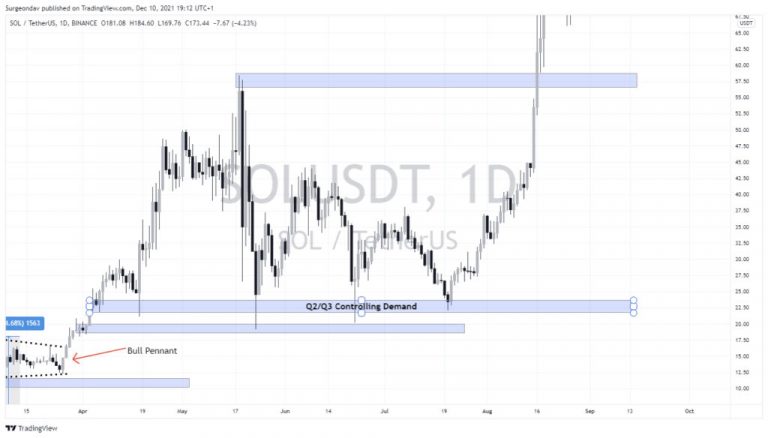
Solana started its Q2 move from the pennant and broke out to resume its buy, making its next significant high, trading around $57 on May 18th, 2021.
However, the Market left critical zones behind to later retest them, especially the designated Q2/Q3 controlling demand.
This demand zone got tested four different times and remains unbroken.
After the zone’s fourth retest, around the $21/$24 price zone, Solana experienced its fastest and longest buy since its launch.
The buy started with a morning pattern leading the price to break above the May high with no significant bearish pullbacks.
Q3/Q4 2021
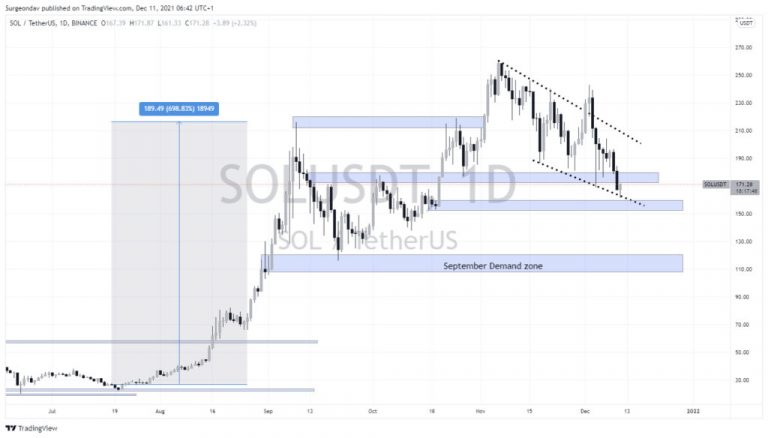
Solana’s biggest buy started from its July 21st demand zone and realized a 700% increase before it made a new high on September 9th.
The buy was aggressive as it left no noticeable sell retracements to indicate the bears’ existence in the Market.
During that period, the bears got wholly exiled.
Solana then hit a new high and traded at $215.
You missed that, didn’t you?
Do you realize what happened?
Solana’s price increased from $22 to $215 within three months!
Solana’s partnership influx with their investors and revenue boost majorly contributed to this ridiculous price jump during this period.
After hitting this high, the bulls finally had their fill of longing for SOL and handed it over to the hungry bears.
The bears didn’t miss; they dipped the Market 100% down to $120.
Unfortunately for them, that price zone turned into a demand zone and sent them running as the price traded to the upside and only got resisted at the last ATH.
The resistance couldn’t pull the price back down as the price found support at a new resistance-break zone.
After breaking out, the price continued its bull run and hit Solana’s current ATH, around $260. During the summer of 2021, the price of Solana increased significantly due to the growing demand and the NFT hype. However, by the end of that year, the price had already evaporated.
2022
During the summer of 2021, the price of Solana increased significantly due to the growing demand and the NFT hype. However, by the end of that year, the price had already evaporated. In 2022, the collapse of FTX and its sister company Alameda Research significantly affected the cryptocurrency. The two companies had sold a large amount of Solana to avoid bankruptcy.
In 2022, the collapse of FTX and its sister company Alameda Research significantly affected the cryptocurrency. The two companies had sold a large amount of Solana to avoid bankruptcy.
Key characteristics of Solana
- Solana network is arguably the fastest blockchain network with a 45 000 to 65 000 TPS throughput.
- Solana supports its PoS consensus mechanism with a Proof of History pre-consensus cryptographic time stamp technology.
- Solana network uses both Validators and Delegators.
SOL tokenomics in a nutshell
- A 500 million total token supply.
- Over 100K investors and holders.
- 7% Staking APR
- Over $15 billion locked value in staking pools.
- Used for staking and gas payment.
- There is no minimum validation and delegation stake
- Solana network burns 50% of all transaction fees are burned
How to Buy Solana on eToro
In the crypto sector, decentralized finance (DeFi) is a trendy topic. The majority of DeFi infrastructure is based on Ethereum, the world’s largest and most reliable blockchain network for smart contracts. DeFi is powered by smart contracts, which allow for direct processing of trades, financial derivatives, and even insurance on a decentralized platform.
Transaction prices have risen dramatically as demand on Ethereum’s network has increased. This makes it difficult for regular investors to use DeFi on Ethereum, as Ethereum transactions can cost more than $100 during peak times. On the other hand, Solana promises to address the scalability challenges that Ethereum’s network is now experiencing.
Solana, like Ethereum, leverages smart contracts to host decentralized apps (dApps). On the other hand, Solana’s unique features allow for much lower transaction costs while simultaneously improving network speed. Learn how to buy Solana in three simple steps.
Step 1: Open an Account
To purchase Solana coins, you must first register for an account with a cryptocurrency exchange provider that supports the fund’s exchange. Go to eToro homepage.
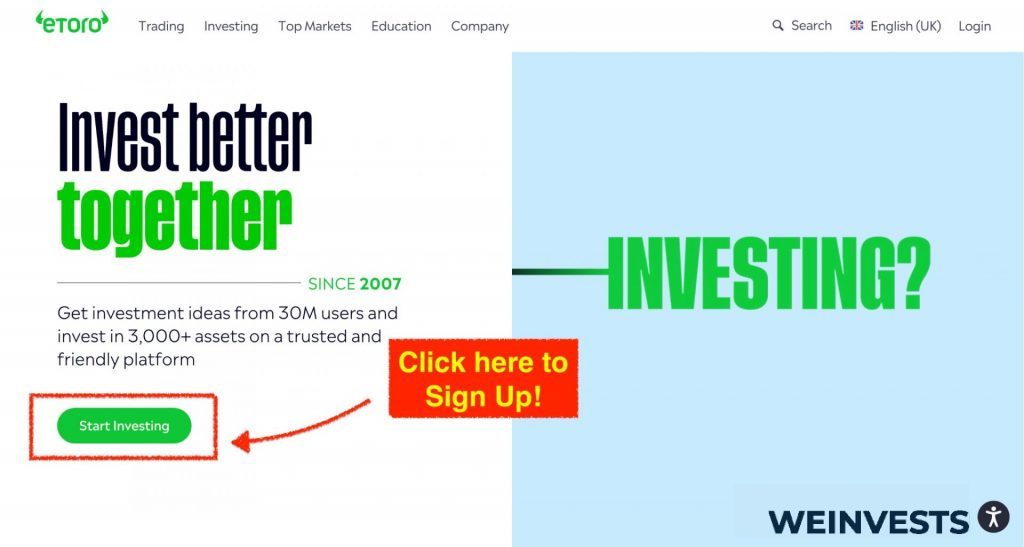
It will require you to fill in only the basic information, which only takes a couple of minutes.
Afterward, a form will appear where people must enter their data like their name, email address, password…
Additionally, before pressing ‘Create Account’ it’s essential that every user reads the Terms & Conditions and privacy policy.
You should check out eToro’s terms, conditions, and policies before proceeding to the next step. Additionally, rereading your information to make sure it doesn’t have any errors is also a good idea.
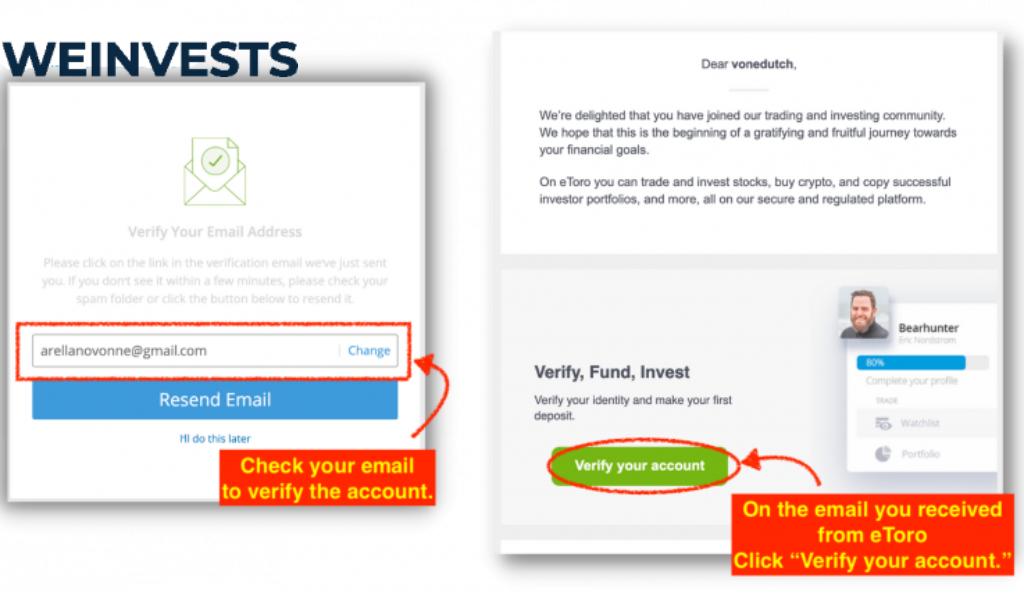
Step 2: Upload ID
Since there are so many scam platforms out there, you need to guarantee that the one you’re trusting is safe. Otherwise, there is no way to make sure that your assets are secure.
In this case, eToro wants to ensure the safety of the users’ cryptos and money. Therefore, everyone needs to go through a verification process, and if you don’t complete it, you’re not able to access the features that the platform offers.
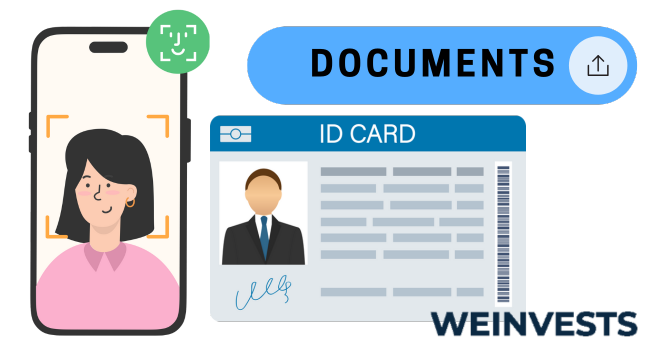
Verifying your identity is not very challenging. You have to upload an ID picture and prove your residence by adding a photo of any utility bill that’s less than three months old.
Step 3: Make a Deposit
If you already verified your account, it’s fantastic! It means you’re ready to fund it and get started with examining all of its features.
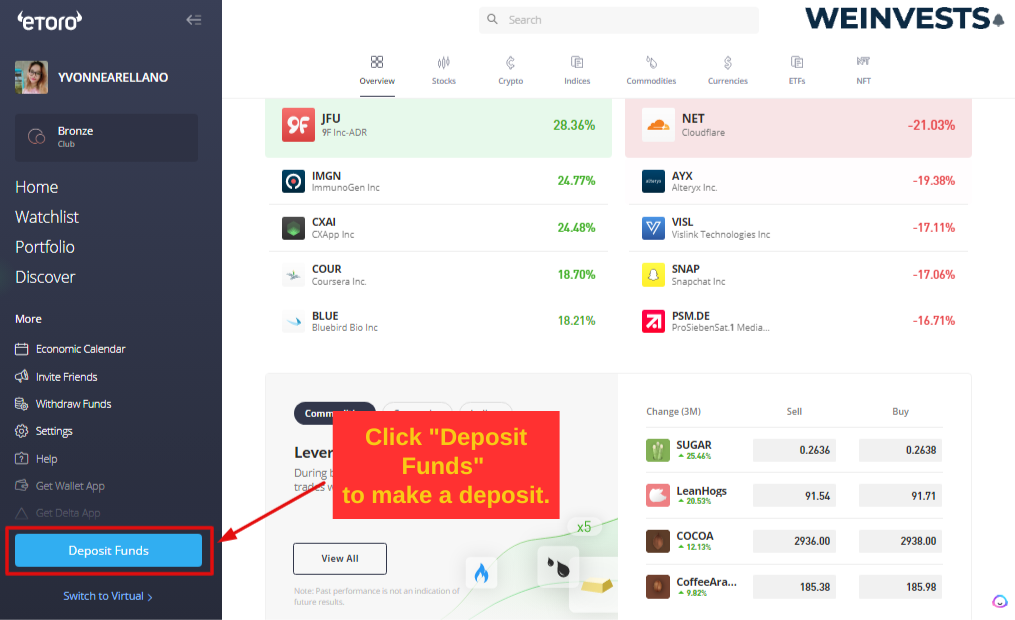
To purchase Solana, you must first determine the appropriate currency pair based on your preferences. If you wish to buy crypto with USD, for example, you should choose the USD combination.
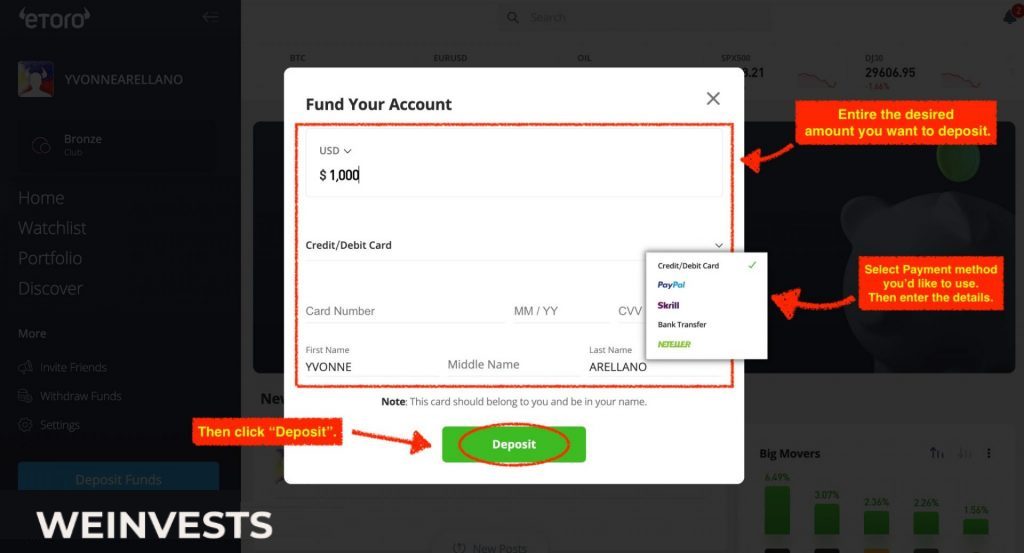
Right now, eToro accepts many different kinds of payment methods, so people do not need to worry about getting their payments into their accounts. They can use eToro Money, credit or debit cards, PayPal, Neteller, Skrill, and more.
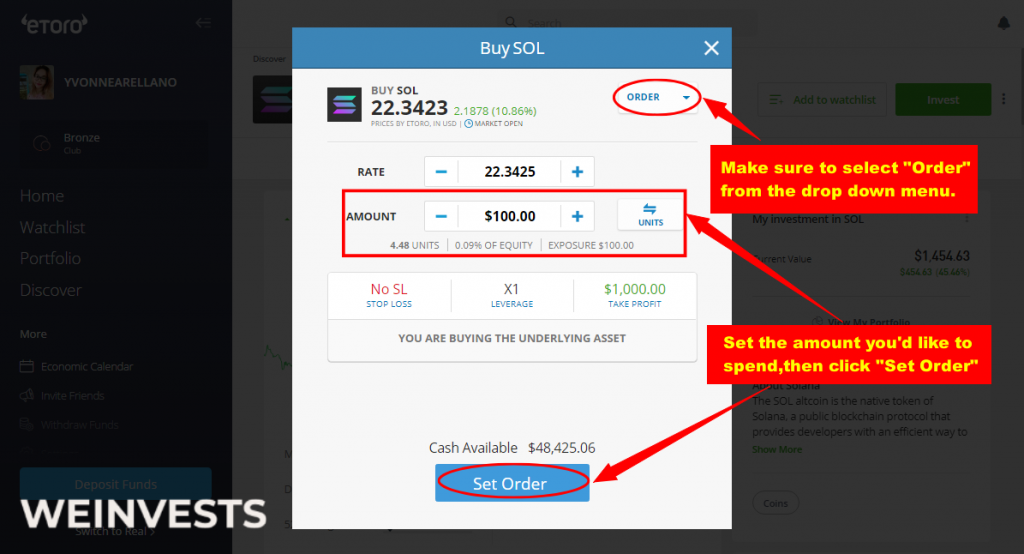
Step 4: Search for Solana
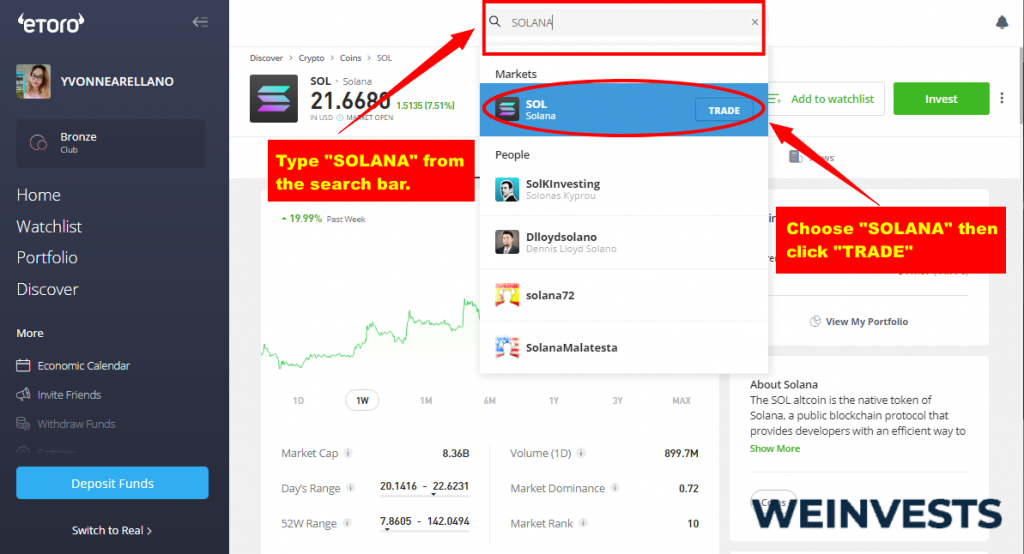
Search for ‘Solana’ and click ‘Trade’ to go straight to the relevant investment page.
Step 5: Trade Solana
Solana can be purchased with USDT or Bitcoin. Tether (USDT) is a $1-pegged stablecoin that mimics investment in fiat currency. Some cryptocurrency investors choose to trade against Bitcoin since it gives them a yardstick for how well their investment is performing.
FAQs
How much lower will Solana fall?
For the remainder of 2021 Q4, SOL is likely to fall below $135 but not below $125. There might be weak support at the $145 zone; since that has only been tested once, it’s unlikely to hold.
However, there is much more robust support around the $127 to $125 zone, and it should be enough to keep the bears at bay.
WeInvests is a financial portal-based research agency. We do our utmost best to offer reliable and unbiased information about crypto, finance, trading and stocks. However, we do not offer financial advice and users should always carry out their own research.
Read More


