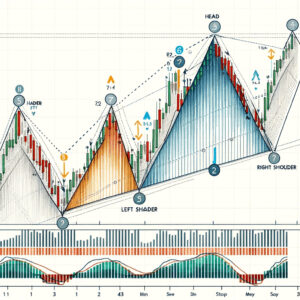
In the world of technical analysis, chart patterns play a crucial role in predicting future price movements. One of the most reliable and widely recognized patterns is the double bottom pattern. This article aims to delve into the nuances of this pattern, exploring its structure, identification, trading strategies, and comparisons with other chart patterns.
Double Bottom Pattern Definition
The double bottom pattern is a bullish reversal pattern that occurs after a downtrend, signaling a potential change in trend from bearish to bullish. It is characterized by two distinct troughs at a similar price level, separated by a moderate peak. The pattern is confirmed once the price breaks above the resistance level formed by the peak.
What Does a Double Bottom Pattern Look Like?

A double bottom pattern resembles the letter “W”. The first bottom is formed as the price reacts to a support level, followed by a partial recovery to form the peak. The second bottom occurs when the price returns to the original support level, before finally breaking out above the resistance level, completing the pattern.
How to Identify a Double Bottom Pattern on a Stock Chart?
Identifying a double bottom pattern requires attention to detail and practice. Here are the steps to identify this pattern:
- Downtrend: Look for a preceding downtrend, as the double bottom pattern is a reversal pattern.
- First Bottom: Identify the first trough, where the price reacts to a support level.
- Peak: Notice a partial recovery in price, creating a peak. The recovery is usually between 10% and 20%.
- Second Bottom: Look for the second trough at a similar price level to the first bottom. The two bottoms should not be exactly the same, but within a few percentage points of each other.
- Volume: Pay attention to volume patterns. Volume should decrease on the decline to the second bottom and increase on the breakout above the resistance level.
Types of Stock Chart Patterns
In addition to the double bottom pattern, there are various other chart patterns traders use to predict price movements:
Head and Shoulders
A reversal pattern that signals a change in trend.

Double Top
The bearish counterpart to the double bottom.

Triple Top and Bottom
Similar to the double top and bottom but with three peaks or troughs.

Flags and Pennants
Continuation patterns that signal a brief consolidation before the previous trend resumes.

Triangles
Continuation patterns that can be symmetrical, ascending, or descending.

How to Trade a Double Bottom Pattern?
Trading a double bottom pattern involves several key steps:
- Confirmation: Wait for the price to break above the resistance level with increased volume to confirm the pattern.
- Entry Point: Enter the trade once the pattern is confirmed.
- Stop Loss: Place a stop loss below the second bottom to limit potential losses.
- Profit Target: Set a profit target at a distance equal to the height of the formation, added to the breakout point.
Double Top vs. Double Bottom Pattern
While the double bottom pattern is a bullish reversal pattern, the double top is its bearish counterpart, signaling a potential reversal from an uptrend to a downtrend. The double top pattern resembles an “M” and is characterized by two peaks at a similar price level.
Failed Double Bottom Pattern
Not all double bottom patterns lead to a bullish reversal. A failed double bottom pattern occurs when the price breaks below the support level of the two bottoms instead of breaking out above the resistance level. Traders must be cautious and use stop-loss orders to manage risk.
Double Bottom Pattern Drawbacks

While the double bottom pattern is a powerful trading tool, it has its drawbacks. It can sometimes be difficult to identify, and false signals can lead to losses. Additionally, it requires a significant amount of patience, as the formation can take several weeks to develop.
Conclusion
The double bottom pattern is a valuable tool in a trader’s arsenal, offering insights into potential bullish reversals. By understanding its structure, identification, and trading strategies, traders can leverage this pattern to make informed trading decisions.
FAQs
What time frames does the double bottom pattern work best on?
The double bottom pattern can be identified on various time frames, but it tends to be more reliable on longer time frames such as the daily or weekly chart.
Can the double bottom pattern be used for all asset classes?
Yes, the double bottom pattern can be applied to stocks, forex, commodities, and other asset classes.
Is volume important when trading the double bottom pattern?
Yes, volume plays a crucial role in confirming the double bottom pattern. There should be a noticeable decrease in volume during the formation of the second bottom and an increase in volume during the breakout.
How do I set a profit target for a double bottom trade?
The profit target can be set at a distance equal to the height of the formation, added to the breakout point.
What should I do if the double bottom pattern fails?
If the pattern fails, it is important to have a stop-loss order in place to minimize potential losses. Additionally, reevaluate the trade and ensure that all criteria for the pattern were correctly identified.
WeInvests is a financial portal-based research agency. We do our utmost best to offer reliable and unbiased information about crypto, finance, trading and stocks. However, we do not offer financial advice and users should always carry out their own research.
Read More


